

Tech vs. Bonds - CCM Short Takes
SHORT TAKES
A common stock market narrative in 2018 goes something like this:
The consistent gains and low market volatility are the hallmark of a blow-off top in stocks.
Is it possible that a consistent, low-volatility market is a common characteristic of early-stage secular bullish moves? The S&P 500 monthly charts below come from nine different periods.
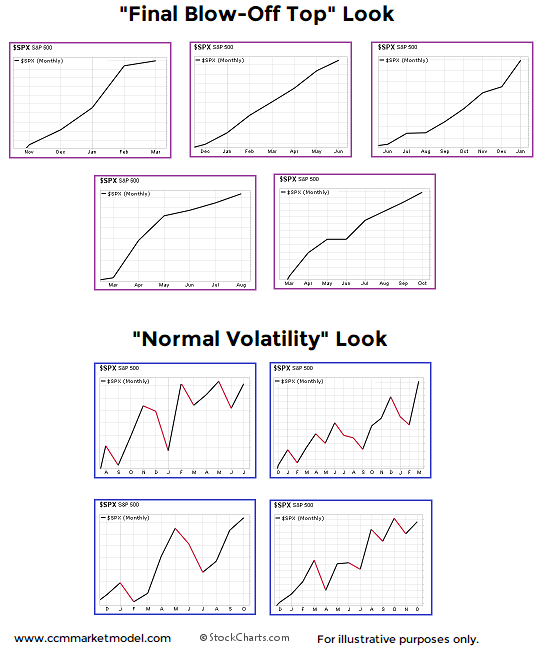
How did stocks perform after the looks above? Were the low-volatility periods followed by horrible bear market losses? The answer is no.
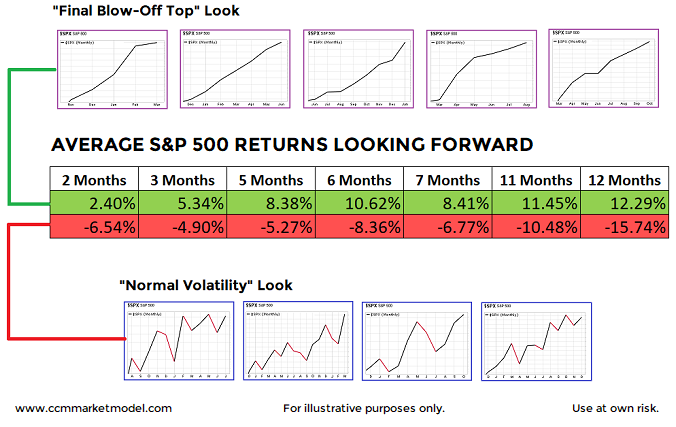
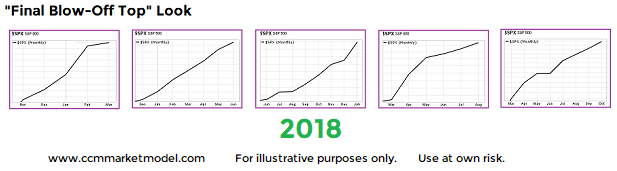
In fact, 2018 was included in the charts above, and it clearly looks more like the favorable periods relative to the unfavorable, higher-volatility periods.
The charts and concepts are described in detail in the video below.
Last year Wall Street was overly conservative with what The Wall Street Journal referred to as their "pathetically wrong" 2017 stock market forecasts. This year the conversation has come full circle, with countless calls for a late-stage bull market 'melt-up'.

Since a 'melt-up' implies a certain degree of irrational behavior that could be followed by a harsh bear-market lesson, it is prudent to see what present-day and historical facts have to say about the seemingly logical melt-up theory. This week's video presents charts in an objective and unbiased manner, allowing you to draw your own melt-up conclusions.
Recent posts on Shiller's CAPE ratio and standard PE ratios provide some additional insight into the melt-up equation.
Were Charts Helpful In 2017 And How Can They Help In 2018? Click here.
A common bearish argument making the rounds over the past year goes something like this:
"Stocks have been rising for over eight years; they can't keep going up."
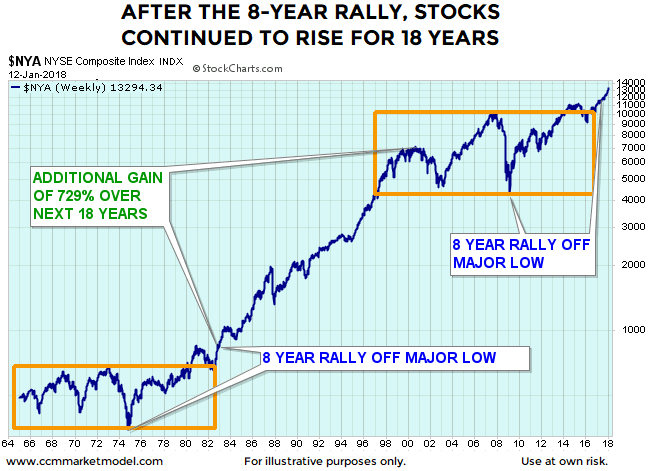
As shown in the NYSE Composite chart below, stocks rallied for eight years off a major low in 1974, broke out to a new all-time high, and then subsequently rallied for an additional 18 years. In present day, stocks rallied off the 2009 major low and broke out in 2017 making a new all-time high.

Given humans tend to extrapolate the recent past into the future, many expect the next major move for the markets in 2018 is a 50%-plus bear market similar to the 2000-2002 and 2007-2009 periods. That is not what happened after the similar historical setup in the early 1980s. Instead of following the 1964-1980 script, stocks tacked on an additional gain of over 700% (see chart below).
If we are to take the "all the charts are meaningless because of valuations" argument seriously, we must convince ourselves that valuations were a useful timing tool between 1964 and the stock market peak in 2000.
In order to make a prudent assessment of the real-world utility of valuations, we must review the information that was available as stocks marched higher between the end of 1982 and 2000. For example, when stocks broke out to a new all-time high in 1982, the median Shiller PE or CAPE ratio looking backwards (1881-1982) was 14.83.

This week's video takes a detailed look at two periods, 1992-2000 and 1956-2000, to evaluate the effectiveness of attempting to use the Shiller PE or CAPE ratio as a market timing tool. In the video, Shiller PEs are reviewed on stock charts, allowing you to draw your own fact-based conclusions.
To view the video in full screen mode, click the square icon in the lower right corner of the video player. To exit full screen mode, hit the Esc key (escape).
Just as there was normal and sometimes gut-wrenching volatility between 1983 and 2000, even if better than expected outcomes occur over the next 3-20 years, volatility will be part of the equation.