
After an ugly week in the stock market, does the hard data now point to a long-term bear market?
Where The Deer And The Antelope Play
The S&P 500 entered a trading range on February 2. Inside a range, it is always prudent to run through a handful of potential outcomes, allowing us to have a strategic, psychological, and tactical road map. Road maps help us stay calm during stressful events.

- If a new bear market has started (TBD), we know with 100% certainty the S&P 500 would have to make a SUSTAINED move below the bottom of the range (2,532).
- If the bull market is simply on pause (TBD), we know with 100% certainty the S&P 500 would have to make a SUSTAINED push above the top of the range (2,801).
- Therefore, new information, from a price perspective, comes with a sustained push above the top of the range or a sustained push below the bottom of the range.
- We learn very little as price whipsaws up and down inside the range.
To move outside the range on Wednesday, March 21, the S&P 500 would have to gain 85 points or drop 184 points. Since those are pretty big moves, the odds favor closing inside the range after the Fed announcement (TBD).
As outlined in numerous posts, the facts that we have in hand today (weight of the evidence on multiple timeframes), favor the SUSTAINED move occurring to the upside in a bullish manner. As we know, a lower probability outcome (new bear market) is always a possibility, which speaks to remaining open to all outcomes (day by day).
Even under a longer-term bullish resolution, it is possible the market will want to retest the S&P 500 low of 2,532. From a psychological perspective, it is also prudent to keep in mind that retests often involve a false breakdown.
A false breakdown could take the form of a relatively short stay (few minutes/hours/days) below 2,532, followed by a sharp and bullish reversal. Obviously, a move below 2,532 would be a high anxiety event for many, and thus, it is prudent for us to take a calm and measured approach if the S&P drops below 2,532 for a short period of time. That is why the term sustained is so important when price is in a range.
Under the low probability scenario (new bear market), the longer the S&P 500 stays below 2,532, the more meaningful it would become relative to increasing bearish odds.
The market was unquestionably in a strong bullish trend before the recent correction. Therefore, until proven otherwise, the base case remains a normal pullback/consolidation/resumption of bull market in the weeks/months ahead. That is not a forecast; simply a probabilistic statement based on the facts in hand. The term base case implies bearish cases must also be respected and accounted for (maximum flexibility).
Volatile Periods Can Produce Satisfying Returns
VOLATILITY IS NEVER FUN
It would be great if the stock market moved in a consistent manner allowing us to calmly watch our account balances grow. Unfortunately, enduring volatility is a necessary evil for those looking to capture long-term investment gains.
VOLATILITY IS NORMAL
Calendar year 1995 featured a very strong trend in the S&P 500, similar to the strong trend that was present in 2017. We are all familiar with the expression the market needs to consolidate its gains, which is exactly what happened in the first six months of 1996. Between January 1, 1996 and June 30, 1996, the S&P 500 had 34 trading days that featured a move to or below the 50-day moving average. Easier markets (1995) are typically followed by harder markets (1H 1996).
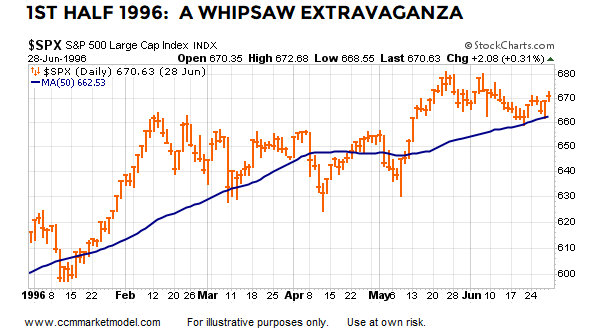
CONSOLIDATION FOLLOWED BY ADDITIONAL GAINS
Harder markets (1H 1996) are typically followed by easier markets (2H 1996 - see chart below). While the second half of 1996 was easier than the first half, it was still no volatility cake walk. Between June 30, 1996 and December 31, 1996, the S&P 500 had 32 trading days that featured a move to or below the 50-day moving average.

DESPITE VOLATILITY, FULL-YEAR GAIN OF OVER 20%
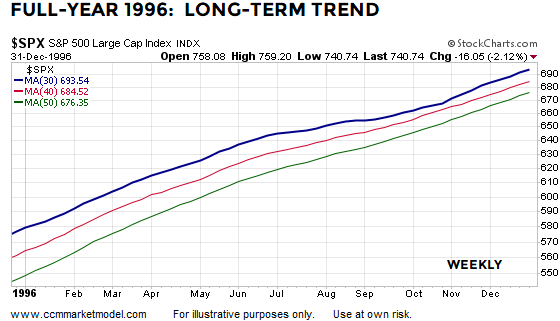
While the intermediate and short-term trends were volatile, the long-term trend remained intact, allowing the S&P 500 to gain 20.26% for calendar year 1996. The weekly chart of the S&P 500 below shows the 30, 40, and 50-week moving averages to illustrate basic concepts.
MARKETS ARE DIFFICULT
As shown via the charts below, trying to avoid volatility can be next to impossible in the financial markets if you wish to book satisfying gains at the end of the year. Under our approach and timeframe, it is best to make decisions based on the weight of the evidence, including multiple timeframes, asset class behavior, and risk-on/risk-off ratios.

MULTIPLE-YEAR VOLATILITY PROFILES DURING BULL MARKETS
Have you ever looked back after the market gains 20% and said to yourself how did I not capture more of that move? Did you look back after the 2000-2002 or 2007-2009 bear market and ask yourself how did I let myself lose that much money? This week’s video explains why those horrible experiences are so common in the stock market and covers methods to minimize the odds of repeating past investing missteps.
VIDEO CORRECTION: At the 13:31 mark, the summary table for CASE B should be 56% and 44% as shown here.
The Key Difference Between Capturing Big Gains And Big Losses In The Stock Market
FINE LINE BETWEEN WINNING AND LOSING
Have you ever looked back after the market gains 20% and said to yourself how did I not capture more of that move?
Did you look back after the 2000-2002 or 2007-2009 bear market and ask yourself how did I let myself lose that much money?
This week’s video explains why those horrible experiences are so common in the stock market and covers methods to minimize the odds of repeating past investing missteps.
VIDEO CORRECTION: At the 13:31 mark, the summary table for CASE B should be 56% and 44% as shown here.