
MOVING PAST DAY TO DAY VOLATILITY
SHORT TAKES
When investors are confident about future economic outcomes, they tend to prefer growth-oriented XLY (consumer discretionary) over defensive-oriented XLP (consumer staples). The 2002-2009 chart below shows the XLY:XLP ratio consolidated for several years before breaking down in October 2007.

In the present day scenario, the XLY:XLP also consolidated for a number of years. The ratio was unable to exceed the orange lines between 2000 and late 2017. Instead of breaking down in a bearish manner (see October 2007 above), the ratio broke out in a bullish manner in late 2017 by exceeding the levels that had acted as resistance for roughly 17 years.

The charts above tell us quite a bit about the market's tolerance for risk in late 2007 relative to the market's tolerance for risk in 2018. Even in the face of recent broader market weakness/consolidation, the ratio is up 6.55% for the month as of April 27.
Is the XLY:XLP ratio the only ratio that paints a "be open to better than expected long-term outcomes" picture? To help answer that question, this week's video covers over 20 ETFs, allowing us to understand the market's message via broad asset class behavior.
Chicago PMI came in at 57.6. Any reading over 50 indicates improving economic conditions. From The Wall Street Journal:
"WASHINGTON—Americans’ spending bounced back in March, while their incomes continued to grow, a sign consumers could drive better economic growth this year."
A December 2016 video covered an extremely rare signal that occurred in 1982 and 2016. Since then, markets have reacted in a bullish manner, meaning we have no reason to doubt the long-term signal that occurred at the end of 2016. Therefore, it may be helpful to understand the stock market's volatility profile between 1983 and 1985.
While there are numerous fundamental differences between the early 1980s and 2016-2018, both periods experienced a breakout from a long-term period of consolidation. Was it easy to stay with the new secular bullish trend that began in 1982 and continued into calendar year 2000? 1983 started strongly with the S&P 500 posting a YTD gain of over 22% in early June.

The early gains were followed by an 8.76% drop that featured a double-bottom above an upward-sloping 200-day moving average.

Stocks then pushed higher for a couple of months and exceeded the previous high.
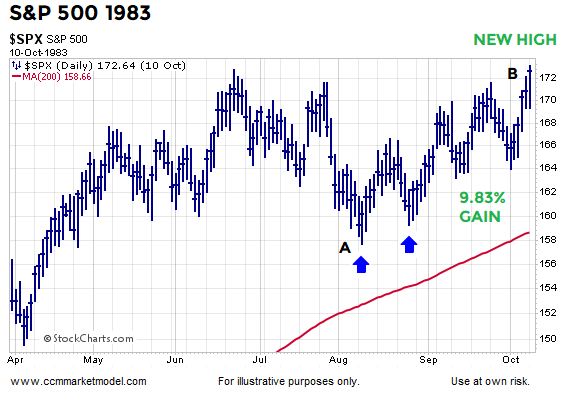
The push to new highs was short-lived and stocks continued their volatile and erratic behavior. Two yellow flags eventually started waving with the slope of the 200-day moving average rolling over and price posting a new low.

Looking out a few months, the S&P 500 remained below a downward-sloping 200-day moving average for an exteneded period. The drop from the prior peak hit 14.93% in July 1984. Far from easy.

Some "things are looking better" boxes were checked over the next few months: (a) price recaptured the 200-day, (b) the slope of the 200-day turned back up, and (c) the S&P 500 broke out from a multiple-month period of consolidation.

Given the wild swings and gut-wrenching corrections, it would have been easy to throw in the towel and pronounce the bears the winners numerous times between June 1983 and August 1984. That would have been an extremely unfortunate mistake given the secular trend tacked on an additional 937% following the low in July 1984.

There was a ton of volatility between point A and point E below, making it very difficult to successfully trade on a short-term basis. The volatility also made it extremely taxing on those watching the markets and their balances too closely.

The table below helps put volatility and the drawdowns of 8.76% and 14.93% in a longer-term context. A hypothetical $1,000,000 portfolio invested in the S&P 500 on 12/31/1982 would have grown to over $10 million in the spring of 2000.

As outlined in the second half of this week's video (12:30 mark), given what we know today, the longer-term outlook remains constructive.
A similar "the bull case is wrong" shakeout could occur over the next year, which reinforces the importance of flexibility, nimbleness, and remaining open to all outcomes. As long as the longer-term outlook remains constructive, short-term frustrations and volatility could still be followed by very satisfying gains. Additional longer-term 2018 charts can be found here.