

The CCM Twitter feed can be found here.
THE HARD DATA
MARKET’S TAKE: MONDAY AND TUESDAY
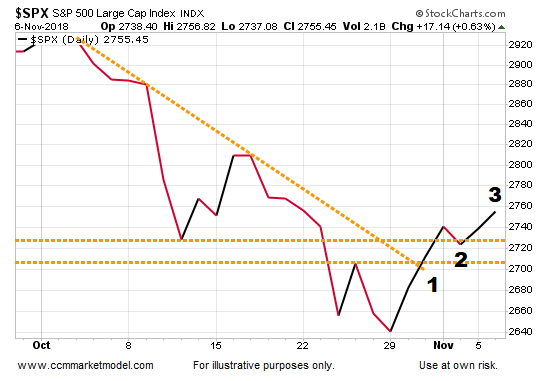
In this week’s video, we noted our approach would be data dependent if the market stayed between the upper and lower bounds shown below. As of the close on Tuesday, November 6, we have fairly constructive candles in 6 of the last 9 sessions, which is in sharp contrast to the extremely rare selling pressure seen in October.

The S&P 500 has now successfully closed above both the 61.8% and 50.0% retracements.

The S&P 500 closed back above all the “areas of possible support” we have been referencing for several weeks.

The S&P 500 has broken a downward-sloping trendline, made a higher low, and a higher high.
During Tuesday’s session, a basket of growth-oriented stocks outperformed a defensive-oriented basket of bonds by 0.62%.

Heading into election night, SPY is beating TLT by 0.85% this week. Point C looks similar to the constructive looks at points A and B.

The Dow printed a higher high today and RSI closed above 50 for the first time in several weeks.

The Global Dow, thus far, is holding above the 2007 high. This is an ongoing retest that may take some time relative to a firm resolution.

The NYSE, thus far, is holding above the 38.2% retracement. Price has moved back into the orange box.

SPY appears to be trying to make a stand near a logical area.

After being lopsided for several weeks, market breadth is showing some signs of improvement.

Many of the concepts above are covered in more detail in this week’s video.
TOMORROW IS A NEW DAY
Additional information about recent portfolio adjustments can be found on the CCM Twitter Feed.
Last Hurrah For Stocks Before Brutal Global Selloff?
GLOBAL DOW FORESHADOWING UGLY USA DECLINE?
Reference Points
SCARY CHARTS
Markets in free fall provide little in the way of guideposts and thus, parking some money on the sidelines is often the only way to prudently reduce unknowns until things settle down.

MILE MARKERS
Corrections and the early stages of a new downtrend never fall into the easy-and-comfortable category and the last three weeks are no exception. When things calms down a bit, the market tends to give us some guideposts to assist in monitoring risk and tweaking allocations. Thankfully, unlike the waterfall chart above, the chart below helps reduce sheep-counting at night.
The look of Wednesday’s candlestick below tells us the session high of 2736 represents an area of possible short-term resistance. The long tail on Monday’s red candlestick tells us the session low of 2603 represents an area of possible support. Thus, we will learn something either way based on how market participants act near those levels in the future.

Use of the upper (UB) and lower bounds (LB) will vary based on how the market behaves in the coming days/weeks (volume, signs of distribution, divergences, moves in the VIX, etc.).
PLANNING FOR THREE MAJOR SCENARIOS
We have to be able to account for three major hypothetical paths for stocks going forward:
A: A sharp bullish push higher
B: A sharp bearish drop
C: Sideways consolidation and whipsaws

The concept of maximum flexibility outlined in this week’s video and in Tuesday’s Short Takes post still applies. Clients can find numerous comments about current market conditions on the CCM Twitter Feed.