SETUPS... STILL NEED FOLLOW-THROUGH

NEW DEVELOPMENT IN TUESDAY’S SESSION

A November 14 Short Takes post compared the present day S&P 500 to the major low in February 2016. If you reviewed those charts in detail, you may have thought the 2018 market seems to be a few days behind the look of the 2016 chart (we thought that). Below are the same charts updated as of the close on Tuesday, November 20, 2018 (right side). You may recall our original comments about the charts:

“If we compare the strength of the move off the first low (compare A to B), you can make a case that numerous indicators looked stronger at point B then they did at point A. For example, in 2016 CCI never approached 100; in 2018 CCI recently cleared 100.”

short-takes-setup-thanksgiving-a-dd.png

ANOTHER INTERESTING SIMILARITY

Tuesday’s session in the S&P 500 featured a gap down. The lowest low in 2016 also featured a gap down.

short-takes-gaps-2016-2018.png

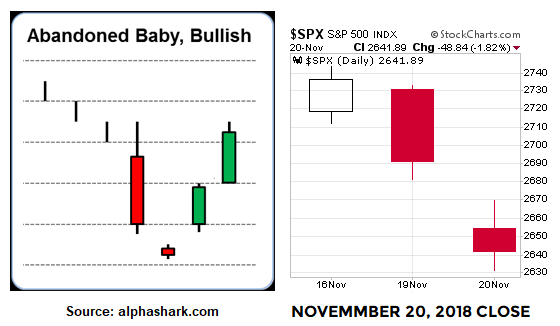
ABANDONED BABY SETUP

The image/text below comes from Investopedia.

abandoned-baby-source-investopedia.png

The first and incredibly important part of the definition above is the potentially bullish abandoned baby is a THREE candlestick pattern. In 2018, we have 2 of the 3 candles, which leaves this firmly in the TBD category. The image below provides another example of the setup relative to the S&P 500’s close on Tuesday.

example-image-as-com.png

What does price action from Tuesday, November 20, 2018 tell us? The market gapped down due to high conviction to get out near the open. The doji-like candle on the daily chart (above right) tells us after the market opened, the battle between bullish conviction and bearish conviction was fairly balanced (unlike the open). The S&P 500 gapped down at the open and traded at 2462 in the first 25 minutes; it closed at the same level at 4:00 pm ET (orange horizontal line below).

ten-min-cc-c.png

HOW MUCH STOCK DO YOU PUT IN THE SETUPS ABOVE?

The simple answer is “not much at all until the market shows us something in 2018”. However, the information does provide “try to be patient” hard data relative to the possibility of a reversal in stocks. As noted numerous times, setups are useless without market confirmation. In 2018, confirmation means some hard data showing an increase in the conviction of buyers relative to the conviction of sellers (some good-looking green candlesticks). As of this writing, we do not have it; still have Wednesday and Friday to go this week.

OTHER TAKEAWAYS FROM 2016 LOW

We cannot think about binary and clean outcomes; markets are much messier in the real world. For example in 2016, if we thought (a) a lower low means a retest fails or (b) several lower closes below the prior closing low means a retest attempt is dead in the water, we would have missed the move that followed.

short-takes-2016-stock-market-retest-b.png

Those who remained flexible and kept an open mind in 2016 had much better odds of participating in the big gain that followed the retest of the low.

short-takes-ciovacco-11-20-2018-a-tweet-c.png

The chart above reminds us how profitable it can be to be patient during periods of high volatility and stress.

IF THE SETUPS FAIL?

The market has proven very little over the past few sessions. Thus, it is prudent to maintain a skeptical bias until we see something above and beyond a setup. Even if these setups fail, we still learn something and it will add to the weight of the evidence on the bearish side of the ledger. A post from earlier today provides some additional comments about what we will be looking for in the days ahead.

MARKET BREADTH AND RETESTS

ANOTHER REFERENCE POINT

Like the VIX, market breadth can be helpful at times and confusing/not particularly helpful at times. For our approach and our timeframe, the helpful periods tend to come in short bursts near peaks or near reversal lows. Therefore, it is possible we can gain some additional insight by reviewing market breadth in the coming days and weeks.

The chart below shows NYSE New Highs - New Lows before and after the S&P 500 intraday low that was made on February 9, 2018. Notice how breadth improved after the low, but did still experience some significantly negative readings after the low (-150, -200, -140). The March 23 low of -199 was lower than the March 1 low of -154, but both were quite a bit higher than the lows in early February.

short-takes-ciovacco-11-20-2018-a.png

As of yesterday’s close, the pattern below (thus far) is not all that different from the February low above; an ugly reading near the low and thus far, tamer negative readings. However, there is one notable difference; the lowest reading below of -521 is lower than the lowest reading of -470 at the February low.

SSM iit llo 009 nnm Y78b.png

If we look at the 2011 case, a few things jump off the page. The lowest reading is in the neighborhood of -1400, which is much uglier than the lowest readings thus far in 2018. Given the 2011 case was followed by big gains in the stock market, low breadth readings viewed in isolation do not mean a bull market is dead and buried. In the 2011 case, breadth improved considerably after the low in the stock market.

short-takes-ciovacco-capital-blog-cca.png

When we review the major 2007 stock market peak, notice how breadth begins to deteriorate in a much tamer fashion than the corrections, but eventually picks up steam. Intraday data is not available in the period shown below.

short-takes-ciovacco-new-highs-x.png

ANECDOTAL EVIDENCE

How can these anecdotal cases possibly help us in 2018? In simple terms, the tamer the subsequent declines in market breadth, the easier it is to remain open to the possibility of a bottoming process. The weaker breadth is in the coming days and weeks, the easier it becomes to remain open to a series of lower lows in the coming weeks and months. Breadth is one small piece of the weight of the evidence.

TUESDAY’S UGLY START

Last week’s video contained numerous data sets that told us to keep an open mind about better than expected outcomes. The video also contained the following:

“We can’t emphasize enough, none of this erases or takes away the 100% legitimate concerns that we have in the short-to-intermediate term. The market has a lot to prove to us [see clip here].”

When we talk about retests, it does not negate the concerning hard data we have in hand, nor does it imply the prior low is “the low”. Having said that the October 30, 2018 Short Takes post noted:

“Notice how it is not uncommon for the stock market to push higher and then backtrack to retest the prior low, something that may or may not happen in 2018.”

short-takes-market-model-ciovacco-rety.png

Retests can take many forms. Retests can come down near the prior low, to the prior low, or drop below the prior low. Retests can pass and retests can fail. Thus, if we are patient, we will learn something either way.

We have a very specific plan if the retest fails. The plan was covered from a generic and conceptual perspective Monday. A second post dated Tuesday, November 20 covers a new S&P 500 setup. The concepts in the following posts remain important relative to remaining open to all outcomes under all circumstances:

Illuminating Charts: Investing Timeframes

S&P 500’s Second Line Of Defense

Why It Is Prudent To Take A Big Step Back

Whipsaws And Market Guideposts

We have hard data in hand that says “remain open to a new downtrend and sustained bear market”. We also have hard data in hand that says “remain open to a bullish reversal and the end of a correction.” Experience says it is best to “stay in the now” and remain highly flexible.

BEAR MARKET SCENARIO

TAKING OUT THE RECENT LOW

We have data in hand, including put-call-ratio readings, that say the October 29 intraday low of 2,603 has similar characteristics to bullish reversal points that held in the past. We also know the October 29 low represents a higher low relative to the February 9 low. The chart below is during Monday’s session with the S&P 500 down 33 points.

short-takes-ciovacco-spx-hgher-thanks.png

MAKING A SERIES OF LOWER LOWS

Concerns would increase if the October 29 low is exceeded, especially for more than a relatively short period of time (a few hours or a few days). Given the market’s renewed weakness during Monday’s session, it is prudent to have a detailed bearish game plan in place.

Our plan is to step out in an incremental fashion based on specific levels. If the market holds above the levels, we will sit tight. If the levels are violated on a closing basis, we will take action. Since markets can bounce back before the end of a week, a weekly close below a predetermined level would be more concerning than a daily close. The size of our incremental steps will be based on the hard data/model readings.

short-takes-ciovacco-spx-nov-19-2018.png

While retests and pullbacks never feel good, price action earlier this year illustrates that bounces can be sharp.

short-takes-ciovacco-spx-nov-2011-casebcf.png

Our predetermined levels respect that many stops are set in the same logical areas, which can cause markets to overshoot those levels and reverse once all the stops have been triggered. We covered the 2011 case in a recent post, which provides an overshoot example during the retest of a prior low.

short-takes-ciovacco-spx-nov-2011-case.png

The chart below is during Monday’s session with the S&P 500 down 45 points. The market still has numerous forms of possible support below.

short-takes-ciovacco-spx-nov-2011-caseb.png

POSSIBLE OUTCOMES

If all levels in our step-out plan are violated, the model will most likely be moving to 100% cash. If the bond market can catch a strong bid, the math may allow for a cash/bond mix. During Monday’s session, the long-term Treasury ETF (TLT) was oscillating between a small loss and no change. A big bullish spike in bonds would also increase stock market concerns in the coming days and weeks; it may happen soon, but it has not happened yet.

QUICK REMINDERS

Flips between improvement and deterioration are not uncommon during periods of volatility and consolidation (see charts below).

SPX 788 9987 uyt.png

While there is nothing magical about any particular level of possible support or possible resistance, having reference points can help reduce overtrading until the market tips its hand one way or another in a more convincing and decisive manner. The excerpts below from the October 30 Short Takes post still apply:

No one knows how 2018 is going to play out. A fact-based case can be made for both the big-move-up and big-move-down theories. Typically (not always), if we can step back from the day-to-day swings in price and our emotions, we will have time to prudently get allocated in line with the evidence, regardless if the outcome is wildly bearish, as it was in 2007, or wildly bullish, as it was in 2016.

The vast majority of common investing and trading missteps are related to having a very short-term focus and making changes based on short-term fear. The market will eventually tip its hand in the “new downtrend” or “correction followed by a new uptrend” direction. If we can shift our focus to the bigger picture, the odds of success will increase significantly. If we remain focused on daily fluctuations and short-term outcomes, the odds of success will decrease significantly.

NOT TIME TO PANIC, BUT PRUDENT TO BE PREPARED

The market has shown numerous signs of trying to make a bottom, but still has a lot to prove. The short and intermediate-term data remains unquestionably concerning. If we execute in a cool, calm, and collected manner, we can balance the need to protect capital with the risk of overtrading and dying a whipsaw-induced death of 1000 cuts. It is not unusual for the market to be extremely volatile and frustrating while trying to form a lasting bottom.

short-takes-ciovacco-spx-nov-2011-casebc.png

DAY BY DAY BASED ON FACTS

We are not making any assumptions about whether or not our predetermined levels will hold. We may do nothing in the coming weeks or we may migrate to a 100% cash stance. The market and the data will make the calls. The charts covered on October 30 remind us how helpful it can be to think about day to day swings in the context of the bigger picture.