Maximum Flexibility

SOME SIGNS OF LIFE

It is too early to read too much into the last two days, but we can acknowledge some observable signs of what could be the early stages of an attempt to form a lasting bottom.

Wednesday’s massive, rare, and impressive candle was followed by a 91 point intraday reversal in the S&P 500 today. We have been saying in order to consider migrating from a defensive/principal-protection posture to a more balanced stance, we need the market to show us something. The last two sessions provide evidence of some improvement on the risk-taking relative to risk-aversion front.

short-takes-ciovacco-12-27-2018.png

BONDS: A FAILED BREAKOUT?

Given the S&P 500 remained in an oversold position, we purposely added a relatively small percentage stake to defensive bonds, knowing a rally in stocks could be coming soon. In a short-term narrative that aligns well with the S&P 500’s improvement in the last two days, bonds (TLT) could possibly be in the process of experiencing a failed bullish breakout. If the breakout indeed fails, which is still to be determined, TLT could see increased selling pressure in the days ahead. Therefore, we reduced our exposure to TLT before Thursday’s close.

short-takes-ciovacco-12-27-2018-9.png

TLT was up over 1.00% intraday Thursday (doing well when stocks were getting hammered) and looking like it was going to print a convincing breakout. When stocks staged the impressive intraday rally, TLT moved to more of a “this breakout could be failing” look and closed with a tiny gain of 0.02%.

MAY MOVE TO A MORE BALANCED APPROACH

If the S&P 500 can stay out of free-fall mode and can continue to show signs of what looks like a possible bottoming process, the model will have us move to a more balanced approach in the short run. If we can add a nominal amount of equity exposure, it will allow us to have a modest exposure to both sides of the equation (growth and defensive). The market’s profile has sustained so much damage that cash will remain a fairly substantial part of the equation until the data improves.

This weekend’s video will outline the rationale for having a cash/bond/stock mix and why it would allow us to be more flexible and patient in the weeks and months ahead. It is possible stocks and bonds will alternate between periods of leadership; that could be true in a devastating bear market scenario (see example below) or a “stocks are trying to form a lasting bottom” scenario. Once things calm down a bit, the model prefers to be in a more neutral vs. one-sided stance. The stock market still needs to show additional signs of improvement (TBD).

short-takes-ccm-24 rty.png

GETTING TO THE RIGHT PLACE CAN BE MESSY

Corrections, bear markets, and the process of forming a lasting bottom can all lead to frustrating volatility and whipsaws. The recent 2018 plunge could lead to much lower lows in stocks or a bottoming formation. In either case, a period of sideways confusion and consolidation could be coming in the weeks/months ahead. A mixed cash/bond/stock allocation could help us be patient, allowing the market to digest the recent plunge before deciding which way the next trending period will break.

This weekend’s video will provide numerous “hang in there during the messy period” examples that occured in bear markets and sharp corrections. Messy periods are often followed by much cleaner periods marked by stronger trends, along with a sharp reduction in whipsaws, frustration, aggravation and trading frequency. For example, whipsaws (bad trades) were common during the bottoming process in 2011. Eventually, the frustration was followed by a “forget the whipsaws” gain of over 97%. This too will pass. The market will decide how, which way, and when.

short-takes-2011-stock-market-crash.png

MORE DETAILS COMING IN WEEKEND VIDEO

The video will try to address additional questions that clients may have in this environment.

This post is written for clients of Ciovacco Capital Management and describes our approach in generic terms. It is provided to assist clients with basic concepts, rather than specific strategies or levels. The same terms of use disclaimers used in our weekly videos apply to all Short Takes posts and tweets on the CCM Twitter Feed, including the text and images above.

Technical Damage

As noted last week on Twitter, sharp oversold rallies tend to occur within the context of steep declines.

short-takes-tweet-12-12-0.png

The market’s technical profile was weak before the 2018 lows were taken out and has only gotten weaker since the bearish breakdowns. Thus, it is going to take more than an oversold rally to repair the damage. The market may want to come back and retest the 2018 lows. Until proven otherwise, the concept of “what once acted as support, may now act as resistance” applies.

short-takes-spx-22-367.png

If we can remain disciplined and patient, bear markets often lead to excellent longer-term opportunities. This weekend’s video will provide additional insight into the recent damage and possible “where do we go from here” scenarios.

Fed Underestimating Market Concerns?

FED: THEN AND NOW

On October 2, the S&P 500 was trading within an eyelash of its all-time high. Then, Jerome Powell made the remark that interest rates were a long way from neutral. The stock market’s reaction to the comment is shown below.

short-takes-fed-giant-mistake.png

STOCKS TRY TO FIND A BOTTOM ON OCT 29

In recent weeks, weekly videos and Short Takes posts have covered concerning shifts in longer-term trends that occurred in the weeks following Powell’s October 2 comments. In terms of assessing shifts in the market’s longer-term economic view, a few charts can illustrate broad concepts. When the S&P 500 was trying to rally off the October 29 low, defensive long-term Treasury bonds subsequently printed a new year-to-date low on November 2, which hardly looks like a market concerned about the economy or a bear market.

short-takes-ciovacco-tlt-new low.png

The same can be said for the long-term trend in the relative performance of bonds vs. stocks. After the stock market’s attempt at forming a lasting bottom on October 29, the bond-vs-stock ratio still had a downward-sloping 200-day moving average that was also printing a new YTD low.

short-takes-ciovacco-tlt-new low-2.png

A NOTICEABLE SHIFT

Our approach makes decisions based on the hard data related to longer-term trends. As shown above, the hard data on November 2 still favored the trend in stocks relative to bonds and the tepid conviction to own TLT relative to the conviction to sell TLT was producing lower lows. If we fast forward to the close on December 19, 2018, we see a noticeable and measurable shift in the hard data.

short-takes-ciovacco-tlt-new low-3.png

ANECDOTAL EXAMPLE OF SHIFT IN MARKET’S RISK TOLERANCE

We can make a comparison to an extreme historical case via a similar shift that took place in November 2007. The 2007 chart below and the 2018 chart above both reflect increasing concerns about the economy, earnings, and the stock market.

short-takes-ciovacco-tlt-new low-5.png

BIGGER PICTURE - ANECDOTAL CASE

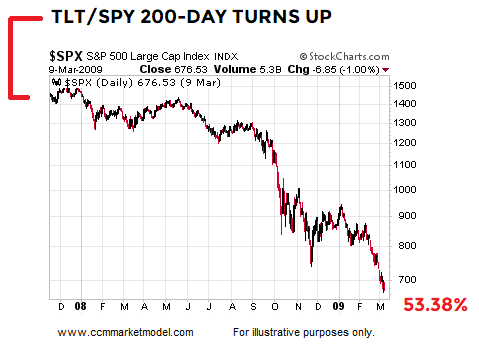
While we know every correction does not morph into a bear market and not every bear market morphs into a crisis, understanding what happened next in 2007 helps put some context around the model’s recent allocation decisions. Between the day the 200-day moving average for the TLT/SPY ratio had noticeably turned up to the final bear market low in 2009, the S&P 500 lost an additional 53.38%.

short-takes-tlt-spy-2007.png

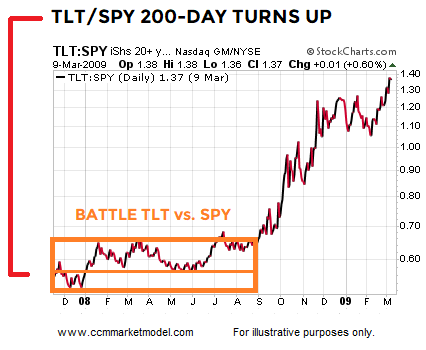
History tells us stock market corrections, and especially bear markets, can experience sharp oversold countertrend rallies. We also know stock market corrections/bear markets can end at anytime. Thus, the model moves in an incremental manner. Notice after the 200-day moving average turned up in the TLT/SPY ratio, bonds did not begin to clearly outperform stocks for many months (see orange boxes). Therefore, a bond/stock mix remained prudent for some time before bonds clearly separated themselves in late August 2008.

short-takes-tlt-spy-2007s.png

SIMILAR CONCEPTS - 2000 CASE

We are using these examples to illustrate basic concepts. There is nothing magical about making decisions based solely on the slope of the TLT/SPY ratio. We have noted in weekly videos numerous times the real ugly portion of the 2000-02 bear market in stocks did not begin until September 2000. Did concerns about the economy/earnings/stocks show up in the TLT/SPY ratio? Yes, in this case we are using VUSTX and VFINX as proxies for the ETFs.

short-takes-ciovacco-tlt-new low-2000-case.png

What happened in the stock market after the TLT/SPY 200-day clearly turned up in September 2000? Even though the S&P 500 peaked in March, migrating to a more defensive allocation still paid big dividends given the S&P 500 dropped an additional 47.01%.

short-takes-tlt-spy-2000-drop.png

Given the oversold nature of the S&P 500 in December 2018, we have to respect violent countrend moves can come at any time. Notice after the TLT/SPY 200-day clearly turned up in September 2000, bonds did beat stocks, but there were also lengthy countertrend moves when stocks significantly outperformed bonds. Hence, the incremental approach to allocation shifts.

short-takes-tlt-spy-2000-funds-b.png

DEC 19: MARKET’S INITIAL REACTION TO FED

The Fed appeared to play a role in the stock market’s rapid descent that began in earnest in early October of this year. Based on early returns, the Fed seemed to once again greatly underestimate the market’s concerns related to the economy and monetary policy. From a Bloomberg opinion piece regarding the December 19 Fed statement/rate decision/press conference:

The first big shock came at 2 p.m. New York time, as the Fed statement was released. That eliminated the slight hope that the Fed might decide not to hike at all. Also, the statement was just barely more dovish than the previous one from the Fed.

Implicit in this response was Powell’s belief that the steady move to reduce the Fed’s balance sheet assets and, hence, mop up liquidity, was not going to roil the markets. 

As for the accompanying “dot plot” of economic projections, it was more dovish than its predecessor, but still suggested that policy makers fully expected to boost rates two more times next year.

But the underlying message of the stock market is still emphatically that the Fed is wrong, and that the chances of an imminent downturn are increasing.

THIS IS NOT A FORECAST/PREDICTION OF GLOOM AND DOOM

The intent here is not to imply the S&P 500 will drop an additional 50% from present-day levels. As noted above, history tells us:

  • Every correction does not morph into a bear market.

  • Every bear market does not morph into a crisis.

  • Stock market corrections/bear markets can end at any time.

  • Bear markets/corrections often produce sharp/large countertrend moves.

The point of the exercise is to demonstrate what can happen when long-term trends from multiple areas of the market begin to reflect concerns about the economy and/or monetary policy. The charts above speak to probabilities, which is quite a bit different than certainty. Comments and concepts from December 16 and December 22 still apply.

This post is written for clients of Ciovacco Capital Management and describes our approach in generic terms. It is provided to assist clients with basic concepts, rather than specific strategies or levels. The same terms of use disclaimers used in our weekly videos apply to all Short Takes posts and tweets on the CCM Twitter Feed, including the text and images above.