
RARE THRUST LEANS BULLISH
In last week’s CCM stock market video, we noted the slope of the S&P 500’s 200-day moving average told us to keep an open mind about better than expected outcomes in the days, weeks, and months ahead. A recent development on the breadth front also falls into that bullish-open-mind category.
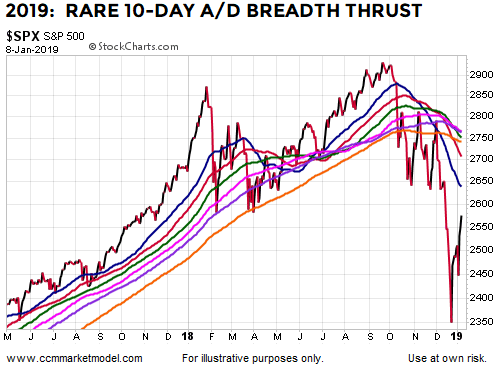
A ten-day advance/decline breadth thrust was completed on January 8, 2019. Given a similar breadth thrust has only taken place twenty-five times since 1945, it is fair to say this type of thrust is very rare. It is even more rare for the thrust to take place from a weak profile with the following distinguishing characteristics:
Price was below all the generic moving averages we have been using in recent videos to illustrate basic concepts about trends.
The slopes of all the moving averages were down to flat-ish (50-day to 200-day).
The thrust occurred after a sharp vertical plunge, and thus formed a V-pattern.
We reviewed all twenty-five previous cases and found only a handful that align well with the present-day market. The best fit appears to be the breadth thrust that occurred off the 1962 plunge low. Note in both the 2019 case above and the 1962 case below, the market was clearly in a downtrend.

Even if you take a very liberal “ish” type approach when making the comparisons, only four cases come close to checking all the boxes shown in the table below: 1962, 1971, 1982, and 2019. With liberal comparison standards, ten cases can check at least three of the four boxes: 1949, 1958, 1962 (2), 1971, 1982, 1991, 2009, 2016, and 2019.

The source of the ten-day breadth thrust dates is Mark Minervini’s Twitter feed.
BEST MATCH: 1962
Since 1962’s breadth thrust occurred after a plunge and from a very weak technical profile, similar to 2018-2019, it might be helpful to understand what happened after the ten-day thrust that ended on July 10, 1962. Notice like 2018-2019, the thrust began below a downward-sloping 50-day moving average, shown in blue.

As noted in recent videos, often when markets try to form a bottom from a very weak technical profile, sideways consolidation and givebacks occur. The 1962 V-thrust case was no exception. Like 2019, price cleared the blue 50-day moving average, but eventually the market took a break.

In the 1962 case, over 61.8% of the original V-bottom move was retraced before the bulls took back control of the tape. The giveback period lasted two months.

1971 CASE
The 1971 breadth thrust created a V-type look and occurred from a weak technical profile with down to flat-ish slopes.

The V-bottom look continued in the 1971 case with almost no giveback or significant retracement, telling us to be prepared mentally and tactically to add to our stock-related positions in the coming days and weeks. Like many of the bullish cases featured in recent videos, it would assist with bullish odds in 2019 if the S&P 500 can clear the generic moving averages in a convincing manner. Notice the 1971 case also featured a clear break of the downward-sloping blue trendline. In 2019, price has only cleared one of the moving averages to date and remains below the present day downward-sloping trendline similar to the blue one broken in 1971.

As noted above, it is very difficult to find cases that match up extremely well with what stock market participants have dealt with over the past three years from a fundamental, technical, and central bank perspective. While really good things happened off the low in 1971, the market was in a much stronger position looking back 17 months (see two charts below).


Even though the breadth thrust cases lean heavily to the bullish side of the ledger, it does not mean long-term risk-management tactics can be put in storage. The 1971 V-bottom was eventually fully retraced in a painful manner.

1982 CASE
In terms of keeping an open mind about better than expected long-term outcomes, it is difficult to beat 1982 when it comes to historical analogies. The similar ten-day breadth thrust was completed on August 23, 1982.

A common “what to look for in bullish cases” theme is clearing the moving average cluster in a confident manner and consolidating above the cluster. If that occurs in 2019, it would increase bullish odds, which is quite a bit different from bullish certainties.
In the 1982 case, a second “be open to better than expected outcomes” breadth thrust occurred after a period of consolidation that took place above the generic moving average cluster.

We created the table below to help us better understand risk-reward in the historical cases over the next two years. The general conclusion is similar breadth thrusts in the past have been bullish with median gains of 30% over the next two years. Nine of the twenty-five historical cases posted gains of better than 40% over the next two years. Seven of the twenty-five historical cases posted gains of over 45% over the next two years, reminding us that difficult market situations can be followed by very satisfying gains, assuming we are flexible enough to participate if the data continues to improve. However, the red portions of the table below mean the S&P 500 dropped below its level on the date of the breadth thrust, reminding us that we must have risk-management/stop-loss procedures in place even if the data improves in the short run.

The yellow portions of the table above show us that gains tend to moderate over the first ninety days following the initial push off the low. The yellow boxes in the table above speak to consolidation, sideways movement, givebacks, and tamer and more sustainable slopes in the stock market’s advance.
2009 CASE
It is difficult to say the 2009 case aligns extremely well with 2018-2019 from a technical or fundamental perspective. The thrust low in 2009 came following a 50%-plus decline in stocks, a major crisis that brought the sustainability of the global financial system into question, the failure of major financial institutions, and massive central bank and government intervention. We have nothing even remotely close to any of that in 2019.

However, a similar bullish breadth thrust did occur at the 2009 V-bottom low. As you can see in the chart below, the weaker the technical profile, the longer it typically takes to repair the technical damage. With a much more stable profile in 2019, if good things continue to happen, the hard data will begin to improve at a much faster rate relative to the 2009 low.

1949 CASE
While the preceding three years look nothing like 2016-2019, the breadth thrust that was recorded on July 13, 1949 can check many of the similar boxes.

Notice how the observable evidence improves as the market’s bullish turn off the plunge low continues.

1958 CASE
Unlike the present situation, the breadth thrust in 1958 came after a more typical bottoming process that included two retests of the initial low.

Similar to the bottoming process that followed the 1987 crash, the 1958 case featured creeping-higher consolidation within the moving average cluster, allowing the data to improve at a more moderate pace.

1991 CASE
The 1991 case is quite a bit different from the point of the thrust in 2018-2019. The 1991 bottom followed the more typical “process” rather than V format. We can still see evidence of the data improving near the low.

2016 CASE
Given the 2018-2019 thrust came at the recent low and created a V-look (thus far), the 2016 case has some significant differences. From a bullish perspective, the 2016 low was an excellent entry point.

MORAL OF THE STORY
Like the slope of the S&P 500’s 200-day moving average, the similar historical breadth thrust cases tell us to be prepared to add to our equity exposure in the coming days if the hard data and observable evidence can continue to improve. The data tracked by the model should begin to improve at a much faster rate if the V-rally continues.
The breadth thrust data does not really alter our approach in any way since in all the previous bullish breadth thrust cases, the hard data improved allowing for incremental adds to the growth side of the portfolio. It should be noted with any attempt to make a significant low from a very weak technical profile, rallies can still be subject to failure, givebacks, and retests. Therefore, any incremental adds to the growth side of the portfolio will be subject to strict risk-management and stop-loss procedures under our approach. It works both ways in this environment; the data can improve quickly if stocks continue to rally and the data can deteriorate quickly if the rally attempt fails and a series of lower lows is in the cards.
From the lows in 1949, which included a breadth thrust similar to 2018-2019, the S&P 500 gained 96% over the next few years. Notice how significantly different the market’s profile was before the low and after the low. If stocks are to stage a sustained long-term rally in the years ahead, we can be confident the market’s profile will improve in the coming days and weeks similar to the observable shift that took place in 1949.

It is also important to acknowledge it would have been easy for investors to feel that they were missing out during the few weeks of the 1949 V-bottom above; however, with proper execution and discipline it was still possible to capture very satisfying gains after respecting the market’s still vulnerable post-V-bottom profile.
If history is any guide, it would not be surprising to see the current stock rally continue, the data to improve, and for us to incrementally add to the growth side of the portfolio at a much faster rate. However, the market still has a lot to prove and we have to see that improvement, rather than jump the data-based gun. We remain open to all outcomes from wildly bearish to wildly bullish and will continue to take it day by day.

The source of the ten-day breadth thrust dates is Mark Minervini’s Twitter feed.
This post is written for clients of Ciovacco Capital Management and describes our approach in generic terms. It is provided to assist clients with basic concepts, rather than specific strategies or levels. The same terms of use disclaimers used in our weekly videos apply to all Short Takes posts and tweets on the CCM Twitter Feed, including the text and images above.