
HUMAN NATURE AND PLUNGES
Since investor psychology tends to be similar after a sharp plunge in the stock market, subsequent bottoms and/or countertrend rallies often share similar characteristics. The first three cases below all show investor behavior following a sharp 20% plunge in a non-recessionary environment.
The 1987 case featured a sharp oversold rally of 18.82% and a retest of the original low 45 calendar days later.

The 1998 case featured a sharp oversold rally of 13.42% and a retest of the original low 37 calendar days later.

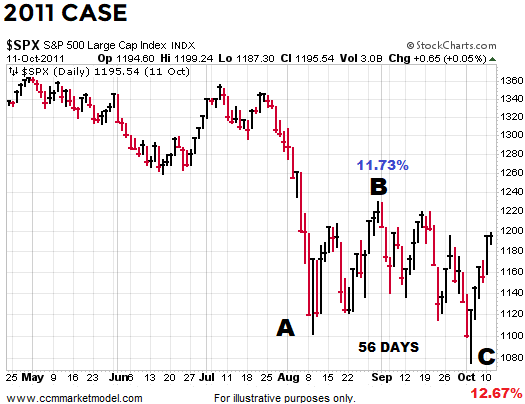
The 2011 case featured a sharp oversold rally of 11.73%% and a retest of the original low 56 calendar days later.
RECESSIONARY CASE
As we have noted in the past, the initial plunge in 2007 also shares some similarities to 2018-19. In the 2008 case, the plunge was followed by a 9.92% rally. The previous plunge low was retested 54 days later. Following the successful retest, the S&P 500 rallied 13.43% before the countertrend rally ended on May 16, 2008.

MORAL OF THE STORY
Respecting 2019 will carve out a unique path, it is possible human nature will once again produce a period of volatility and consolidation in the wake of the December 2018 plunge. Thus far, the current oversold rally seems to align with the historical cases shown above. Therefore, it would not be surprising to see the S&P 500 rally back to the 2600 to 2670 area before retesting the December 2018 low sometime in the next three to six weeks (late January to mid-February) - all TBD.

HOW MARKETS/PROFILES TYPICALLY TURN FOLLOWING PLUNGE
When markets plunge, profiles tilt heavily to the bearish-trend side of the ledger, which is still the case in 2019. For any type of sustainable rally to take place, it typically takes time for the data/trends to stabilize/consolidate, allowing them an opportunity to turn back up after a retest of the original low. The basic concept is illustrated via the 50-day moving average in the 2008 case below. The market’s profile/hard data is extremely weak near the first low (red arrow). After the retest of the low, the period of consolidation/confusion allowed the data to stabilize and subsequently turn back up (blue arrow).

Our purpose is not to forecast any outcome in 2019, but rather to understand and respect a wide range of outcomes, including a V-bottom or failed retest of the December low, followed by much lower lows. The market remains in a downtrend until proven otherwise.