
MARKET WAS A BIT EXTENDED SHORT-TERM
Monday’s session saw the first close above the S&P 500’s upper Bollinger Band (purple arrow) since the current rally began in late December 2018. In early February, the market approached the upper band and then took a very brief pause (blue arrow). Tuesday’s session featured an intraday reversal that started from above the upper band (red arrow). As of this writing, the bigger picture remains constructive. We used the extended short-term look as an opportunity to lock down some gains in a hybrid/growth position, which allows us some flexibility for reallocation if/when the market finds its footing.

RECENT BREAKOUT HOLDING THUS FAR
Three weeks ago the S&P 500 had just cleared the 200-day moving average (shown in red below) and was approaching the highs made in Q4 2018 (blue horizontal line). The chart below first appeared in a February 25 post titled “Markets Hovering Near Important Guideposts”.

The same chart during Tuesday’s session (below) shows the S&P 500 is currently trying to hold above three relevant areas. The market appears to have successfully retested the 200-day earlier this month (A). The orange box (B), thus far, has done little to slow the market’s strong advance off the 2018 low. Last Friday, the market closed above the blue line (C) for the first time and nailed down the 3rd consecutive close above the Q4 highs during Tuesday’s session. The blue line sits at 2813; Tuesday’s close was 2832.

In the chart above, the longer the S&P 500 can hold above A, B, and C, the easier it is to decrease exposure to the hybrid/defensive side of our portfolios and/or add to our existing growth-oriented positions. It should be noted, even under longer-term bullish conditions, the S&P 500 may come back and retest the horizontal blue line which sits at 2813. A retest could take place in a matter of days or could come weeks/months later. Wednesday’s Fed statement and press conference could usher in some relevant information impacting the breakout one way or another.
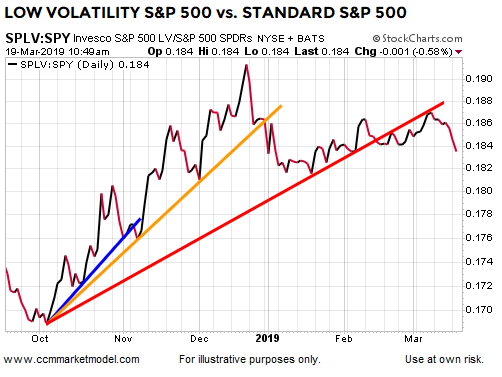
WANING RELATIVE TRENDS
While the S&P 500 Low-Volatility ETF (SPLV) has performed well and is still hovering near new highs, the conviction to own more-conservative S&P 500 stocks has been waning. If the S&P 500’s breakout above 2813 holds (TBD), the relative demand for SPLV could decrease further.
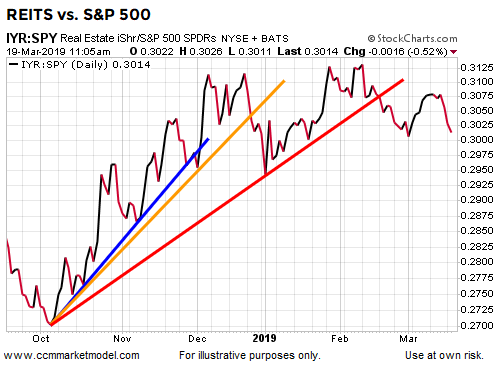
The same concepts apply to real estate investment trusts (REITS). Viewed in isolation, IYR is still hovering near new highs, but signs of relative weakness are evident on the chart below.
Viewed in isolation, gold-mining stocks (GDX) remain in an uptrend relative to the low that was made in 2018. However, the relative trend has not made a new high since late December.

The “lower conviction to own defensive assets” theme carries over to the bonds (TLT) vs. stocks (SPY) chart shown below.

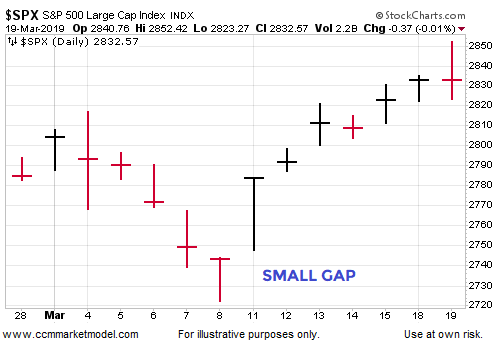
MORAL OF THE STORY
The market’s recent short-term extended condition and Wednesday’s Fed meeting allow for a pause to see how things play out near 2813 on the S&P 500. Since it is always good to understand a wide range of outcomes, there is still a small gap the market may want to revisit near 2747.
LONGER-TERM OUTLOOK
The longer-term outlook remains constructive as outlined in last Friday’s video below.
This post is written for clients of Ciovacco Capital Management and describes our approach in generic terms. It is provided to assist clients with basic concepts, rather than specific strategies or levels. The same terms of use disclaimers used in our weekly videos apply to all Short Takes posts and tweets on the CCM Twitter Feed, including the text and images above.