
LOOKING OUT 2-3 YEARS
If the S&P 500 made a cyclical low in October 2022 in the context of a secular bull market, when we look back in 2-3 years, ETF leaders will most likely come from the technology sector, with a large cap bias. Even if mid-cap and small-cap stocks continue to lag, they will experience intermittent periods of outperformance (countertrends in the context of a long-term relative downtrend). A bias toward higher interest rates and higher inflation, along with current long-term trends, say bonds may produce disappointing relative performance.
STRONG LONG-TERM TRENDS
A secular trend is a long-term trend that lasts several years or even decades. As shown in the weekly chart of the S&P 500 below, the strongest portions of a secular trend typically see the market hold at or near an upward-sloping 200-week moving average (shown in blue). The secular trend begins in 1950 with the market making subsequent stands in 1953, 1958, 1962, and 1966. Secular bullish trends tend to make a series of higher highs and higher lows.

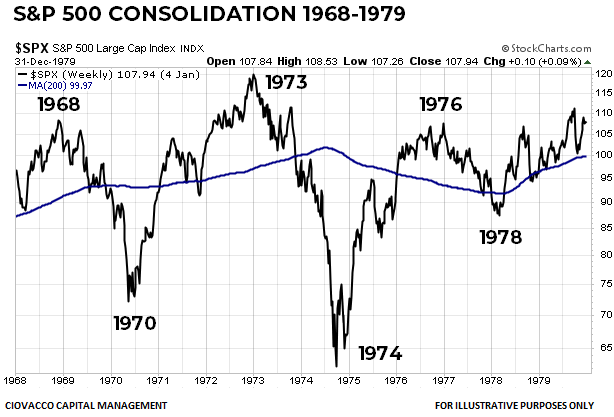
period of long-term consolidation
Markets move in fractals, which means they exhibit similar behavior and produce similar patterns on multiple timeframes. Thus, the concept that after a big move ‘the market needs to consolidate its gains’ applies to S&P 500 charts spanning decades. The S&P 500’s secular trend (above) started to wane after the peak in 1968. The S&P 500 posted a higher high in 1973 but was already in a long-term period of consolidation or sideways movement that remained in place through 1979. A stark difference between the chart above and the chart below is the S&P 500 made stands near the 200-week in one case and failed to do so in the other case.
A NEW SECULAR TREND
It is common knowledge in markets that long-term periods of consolidation followed by successful bullish breakouts are often followed by strong trends and significant gains. This concept applies to very long-term charts as well. After going nowhere in the 1968-1979 window, the S&P 500 made a major low in 1982. The 1982 low kicked off a secular trend in the stock market that lasted until 2000. Once again, in stark contrast to the chart above, the chart below features the S&P 500 making stands near an upward-sloping 200-week moving average. The S&P 500 made stands near logical areas in 1984, 1987, 1990, 1994, and 1998. In each case, the market rallied for years after holding near an upward-sloping 200-week moving average.

ALL GOOD THINGS MUST COME TO AN END
As shown in the chart below, the S&P 500 made very little progress for over a decade in the 1999-2012 window. Unlike the secular trend (1982-2000) period above, the S&P 500 was unable to make sustainable stands in 2001 and 2008 near the 200-week moving average.

TRENDS CAN LAST A LONG TIME
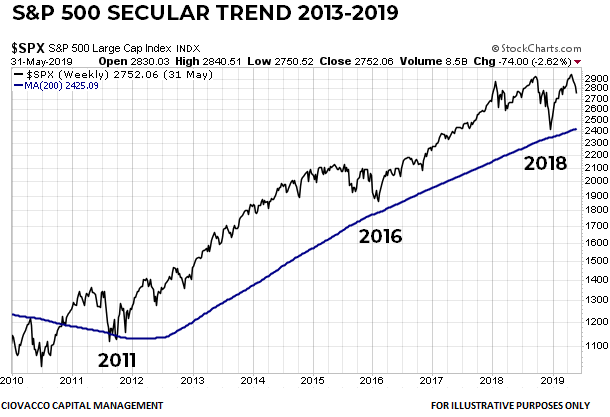
The S&P 500 began to recapture the secular trend look after the low in October 2011. Stands were made near an upward-sloping 200-week in 2016 and 2018, which is exactly what we would expect during a secular bull market.
DOES IT STILL LOOK LIKE A SECULAR TREND?
The S&P 500 made a stand near an upward-sloping 200-week in 2020. After a significant drawdown in 2022, the S&P 500 continued to read from the secular bull market script and made a low in October near an upward-sloping 200-week moving average. In recent weeks, the 2022-2023 S&P 500 rally has cleared hurdles that the index was unable to clear in the failed 2008 rally, which increases the odds the October low was “the low”. We know secular bullish trends tend to make a series of higher highs and higher lows. Thus, if the secular trend remains in place, the S&P 500 should (a) hold above 3800 on any normal-and-to-be-expected pullback and (b) eventually make a higher high above 4800. The secular trend thesis would be in doubt with any sustained move below the 200-week moving average.

SPY, the S&P 500 ETF, has a secular trend look with price above an upward-sloping 200-week moving average.

QQQ, the NASDAQ 100 ETF, rallied near an upward-sloping 200-week in 2022, consolidated for several months and then pushed to a new rally high in recent weeks. The QQQ chart is extended from the recent base, which means some fairly significant giveback would not be surprising. Until proven otherwise, QQQ remains in a secular uptrend, which means even a significant correction would most likely be followed by higher highs.

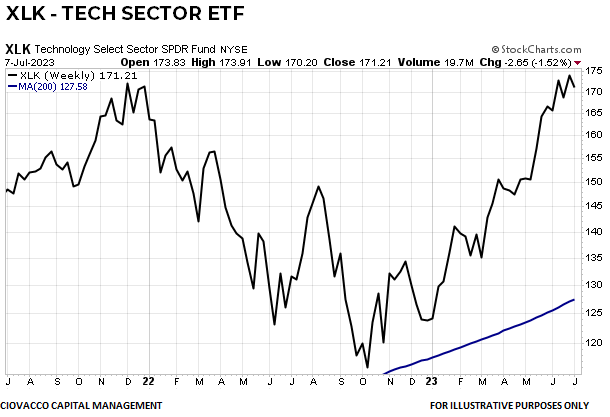
A similar situation exists with XLK, the technology sector ETF. The near-vertical look of the chart in recent weeks says a countertrend move may be in the cards (the market will make that call). Even a sharp correction would most likely see price hold above an upward-sloping 200-week. Secular trends make a series of higher highs and higher lows, telling us if the secular trend remains in place any correction would be followed by a higher high. A sustained breach of the 200-week moving average would put the secular trend in doubt.
SECULAR TREND LEADERS
The XLK vs. SPY ratio below made a stand near an upward-sloping 200-week in Q1 2023 and went on to exceed the 2021 high, which means tech’s long-term secular trend in leadership remains in place. A sustained move below the 200-week moving average would put tech’s leadership in doubt. Given the steep slope of the trend below, a period of underperformance would not be abnormal or surprising; it would be classified as a countertrend move within the context of a longer-term bullish trend.

SECULAR TREND LAGGARDS
The IWM vs. SPY ratio below illustrates an important concept regarding all trends, bullish and bearish. All trends have countertrend moves. Thus, if IWM started to outperform SPY, that would be classified as a countertrend move within the context of a long-term downtrend in the IWM vs. SPY ratio (until proven otherwise). This means small caps could hypothetically outperform in the second half of 2023, but significantly underperform in the next 1-5 years.

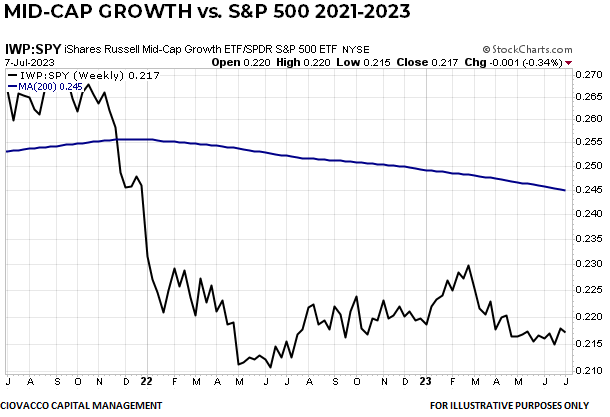
As shown below, mid-caps also remain in a long-term relative downtrend versus the S&P 500, which means periods of outperformance are classified as normal countertrend moves until proven otherwise.
THE GLOBAL BULLISH TREND
Secular trends typically find buying support at or near an upward-sloping 200-week. Thus far, that has been the case with stocks outside the United States. Global Stocks Ex-USA (below) pushed back above an upward-sloping 200-week in late 2022/early 2023. Any sustained move below the 200-week moving average would put the secular trend in doubt. The chart in front of us still looks like a long-term uptrend with price above an upward-sloping 200-week moving average.

BONDS HAVE A MORE CONCERNING LOOK
A bias for higher interest rates and higher inflation, along with current long-term trends, say bonds may produce disappointing relative performance. Unlike the stock ETFs shown above, the Aggregate Bond ETF remains below a downward-sloping 200-week moving average.
