
Long-Term Buying Opportunity
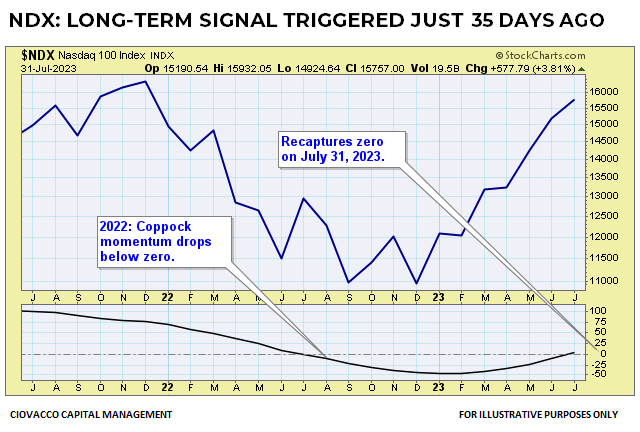
Thirty-five calendar days ago, the NASDAQ 100 triggered an extremely rare long-term momentum signal that should be of great interest to long-term investors. According to Stockcharts.com, “The goal of the Coppock Curve is to identify long-term buying opportunities,” which speaks to margin of safety when putting hard-earned capital in harm’s way.
Rare Buy Signal
In 2021, with market participants growing increasingly concerned about inflation and Fed policy, longer-term momentum began to slow in the NASDAQ 100, the index tracked by the Invesco NASDAQ 100 ETF (QQQ). Multi-year prospects began to improve in Q1 2023 when the Coppock Curve turned back up. A long-term buy signal was triggered on July 31, 2023 when the Coppock Curve moved back into positive territory.
QQQ has a high correlation to the U.S. stock market and the technology sector, thus, this signal provides insight into the long-term investment prospects for the SPDR S&P 500 ETF (SPY) and the Technology Select Sector SPDR ETF (XLK).
How Rare and What Happened In Subsequent Years?
The NASDAQ 100 officially launched on January 31, 1985. Over the past thirty-eight years, a monthly Coppock buy signal has only been flashed four previous times. Since improving long-term momentum reflects expectations related to every fundamental topic you can think of, including valuations, earnings, general economic conditions, health of the credit markets, interest rates, inflation, and Fed policy, it is helpful to review each historical case to see what we can learn about the investment prospects for QQQ, XLK, and SPY in September 2023.
Sentiment Improves After 1987 Crash
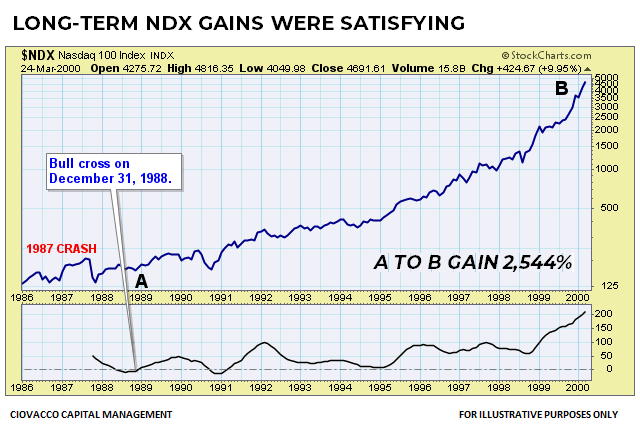
After the 1987 stock market crash, there were lingering questions about the stability of the U.S. economy and financial markets. NASDAQ 100 momentum began to turn more constructive in 1988 and a rare Coppock Curve buy signal was triggered on December 31.

While volatility remained part of the investment equation, the NASDAQ 100 presented investors with a rare long-term opportunity by posting a gain of 2,544% between December 31, 1988 and March 24, 2000.
Momentum Turns After 1990 Concerns
Investors were concerned about a recession following the 1987 crash, however, the National Bureau of Economic Research (NBER) did not declare a recession until several years later on April 25, 1991, stating that an economic contraction began in July 1990 via the press release text below:
CAMBRIDGE, April 25 - The Business Cycle Dating Committee of the National Bureau of Economic Research reached the judgment today that the peak of US economic activity occurred in July 1990. The current US recession thus began in July 1990, in the committee's view.
Thus, an investor that was waiting for a recession probably did not pay much attention to the bullish Coppock Curve signal that triggered on March 28, 1991, 28 days before the recession was officially declared. The market had already discounted the recession via the declines that occurred in 1990.

The stock market was looking to the future after the 1991 Coppock Curve buy signal. Following the rare turn in bullish momentum, the NASDAQ 100 posted an impressive gain of 1,671% before the market peaked on March 24, 2000.

Buy and Hold Is Not Easy
There are times when buy and hold investing seems easy and clearly the only way to go. Unfortunately, nothing is easy in the financial markets as evidenced by the 83% decline in the NASDAQ 100 between March 24, 2000 and the bear market low on October 9, 2002. Did the Coppock Curve flash any long-term buy signals in this painful investing window? No, which makes the 2023 signal even more compelling.

New Dawn After Dot-Com Bust
As you might imagine, after an 83% decline, investors were not as enthusiastic about the merits of technology when sentiment began to slowly improve in late 2002. Long-term NASDAQ 100 momentum finally flashed a Coppock Curve buy signal on August 29, 2003.

The gains following the signal were still extremely rewarding with the NASDAQ 100 posting a return of 61.89% between points A and B on the graph below.

Coppock Curve During The Financial Crisis
The most useful indicators are helpful in bullish and bearish situations. Thus, it is helpful to know what the Coppock Curve was saying during the Global Financial Crisis (GFC). The signal that just occurred in 2023 was never triggered in the 2007-2009 bear market window.

Opportunity Following GFC
Somewhat similar to the abrupt turn in momentum following the NASDAQ 100’s December 28, 2022 bear market low, Coppock momentum began to improve rapidly in Q1 2009 and crossed the monthly zero line on December 31, 2009.

The returns following the rare bullish reversal in 2009 were impressive with the NASDAQ 100 gaining 369% between December 31, 2009 and December 31, 2019.

Comparing Periods In Dollar Terms
If you are looking for a magical system, indicator, moving average, or stock market signal, you will be on an endless and frustrating journey. Nothing is magical, including the Coppock Curve. Having said that, systems, indicators, moving averages, and signals can help with the assessment of the odds of good things happening relative to the odds of bad things happening as illustrated in the two contrasting tables below:

The median NASDAQ 100 gain following the four historical monthly Coppock Curve buy signals was 1,020%. Hypothetically, a $1,000,000 portfolio would have grown to $10,202,644. No monthly Coppock Curve buy signals were flashed during the 2000-2002 and 2007-2009 bear market windows. The median outcome in the bearish windows was a loss of 67%.
Long-term Opportunity: QQQ, XLK, SPY
The recent bullish signal for QQQ (NASDAQ 100) is also favorable for the technology sector since QQQ has a 57% exposure to tech. SPY is also heavily influenced by tech with a sector (XLK) exposure of 28.75%.
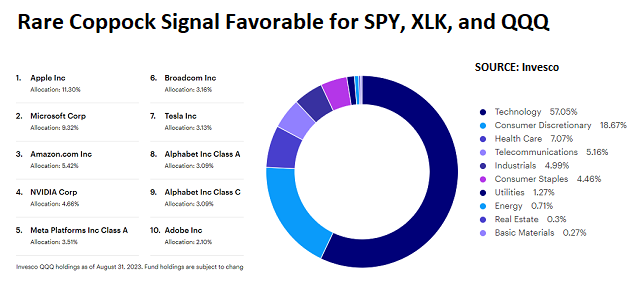
Is it possible other sectors will outperform tech in the coming weeks and months? Sure it is, but the long-term trends unquestionably are in favor of productivity-enhancing and earnings-producing technology.
LONG-TERM MEANS LONG-TERM
A monthly Coppock Curve buy signal speaks to the coming years. It says very little about the next six days, six weeks, or six months.
FACTS ARE COVERED ABOVE
The signal generated on July 31 is a fact. The market’s performance following the historical signals is a set of facts. The purpose of reviewing the facts is to help us better understand probabilistic outcomes, which are significantly different from a prediction or forecast. We will continue to take it day by day with an open mind about a wide range of outcomes.
The Weight Of The Evidence Builds Over Time
The favorable long-term signal for QQQ aligns with the U.S. stock market being in a demographically-driven secular bull market that could last until 2034 or 2035.
Moral Of The Story
Based on a rare long-term momentum buy signal that was flashed for QQQ (NASDAQ 100), the margin of safety equation looks much more favorable today. As evidenced in August 2023, volatility and give backs are a normal part of all trends, including the current favorable trends in QQQ, XLK, and SPY.