Demographics Playing Big Role In Markets

Power Of The Millennials

Markets ultimately price all assets based on the simple law of supply and demand.  Demographics play a large role on the demand side of the equation.  From The Wall Street Journal

The U.S. homeownership rate rose in 2017 for the first time in 13 years, driven by young buyers who overcame rising prices, tight supply and strict lending conditions to purchase their first homes.

This time, what’s driving the market is a shift in favor of owning rather than renting coming from the largest homebuying generation since the baby boomers: millennials.

“There’s no government incentive program in sight that is having this effect,” said Susan Wachter, a professor of real estate and finance at the Wharton School at the University of Pennsylvania. “This is back to basics.”

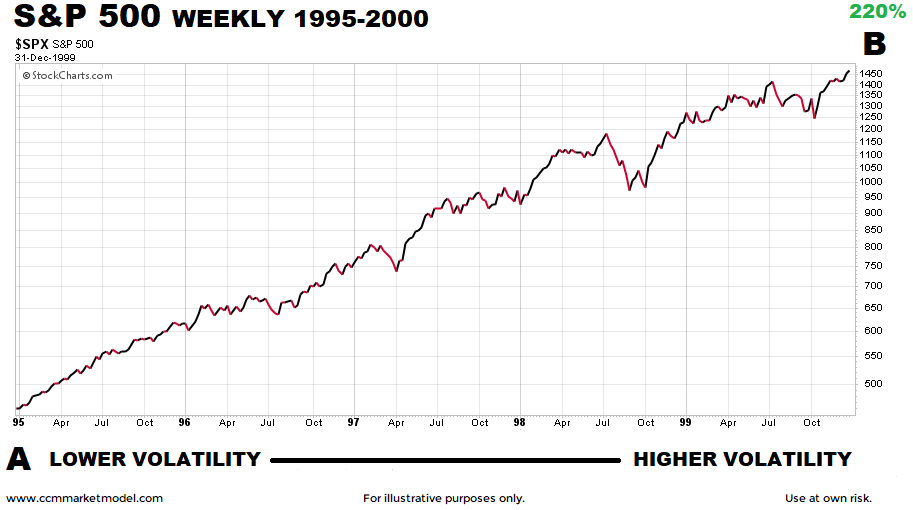
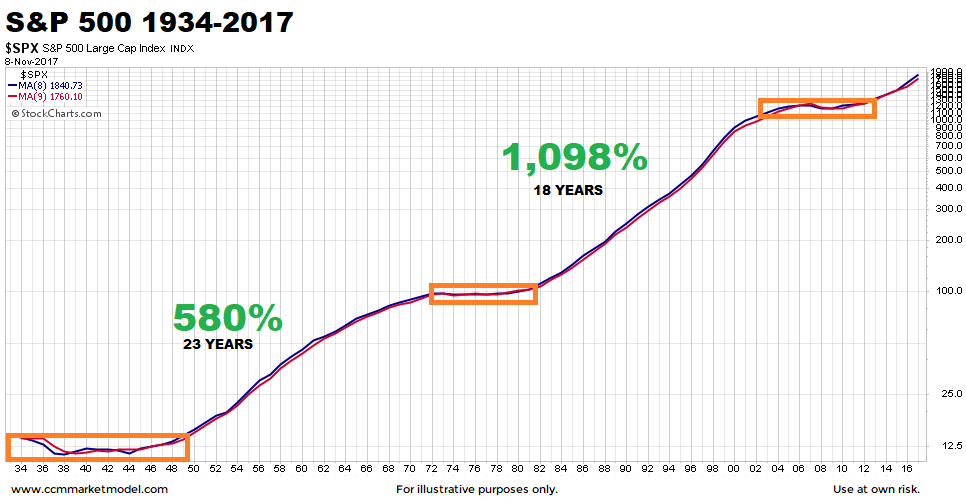
Stocks, Baby Boomers, and Millennials

The baby boomers were 22-29 years old when a secular trend began in the stock market in 1982; the trend lasted 18 years.  In 2017, the millennials were 13-35 years old.  The demographics and chart patterns shown below tell us to keep an open mind about better than expected outcomes in the stock market over the next 5 to 20 years.

short-takes-stocks-demographics.png

These concepts were covered in detail in a September 1, 2017 video.  Since publishing the video, stocks and housing have both appreciated. 

Is A 20% 1998-Like Plunge Coming In Stocks?

FACTS INSTEAD OF FEAR

When investors see red covering their screens, it can understandably be unnerving.  Since many are comparing the recent move in stocks to the late 1990s (don't include us on that list),  a fair question might be:

After moving up rapidly in 1998, the S&P 500 plunged over 20%.  Is the present day market similar to the peak in 1998?

The chart below shows the four months leading up to the 1998 plunge (see orange box).  Notice: (a) price was making a series of lower highs for almost three months below the red line, (b) the fastest moving average (blue) came down near the slowest moving average (black) in June 1998, which is indicative of a weakening stock market trend, (c) after the peak was made, the vulnerable trend allowed the blue moving average (MA) to drop rapidly toward the black moving average, eventually resulting in the blue MA moving from the top of the moving average cluster to the bottom, and (d) after that point, really bad things happened.

ccm-short-takes-1998-stock-plunge-a.png

HOW DOES THE SAME CHART LOOK TODAY?

The answer to the question above is "much better".  Instead of threatening to move to the bottom of the moving average cluster, the fastest moving average (blue) remains firmly on top, which is indicative of a strong bullish trend.  Instead of price making a series of lower highs as it did below the red line in 1998, the S&P 500 has printed several new all-time highs over the last four months.

ccm-short-takes-1998-stock-plunge-b.png

MORAL OF THE STORY

While anything can happen in the markets, the present day trend in the S&P 500 has a stronger and more sustainable look than the S&P 500 did before and after the peak in 1998.  Strong trends, similar to the one we have in 2018, typically go on to print a new closing high after relatively shallow (2% to 6%) pullbacks.

The comments above are based on the facts we have in hand today.  If the data deteriorates in a meaningful manner, we will classify the decline as "volatility to respect" and make any necessary defensive chess moves.  Under our approach and based on our timeframe, that has not happened yet, and thus, the normal two-day pullback falls into the "volatility to ignore" category. 

We will continue to take it day by day, monitoring the hard data with a flexible, unbiased, and open mind.  If action needs to be taken, it will be taken.

Volatility: Realistic Expectations

Learning From 1995-2000

As we have noted on numerous occasions over the past year,  market setups in the 1994-1995 period are similar to the 2016-2017 period.  The strong trends that were present in 2017 are similar to the low-volatility year 1995.  Therefore, it may be helpful to examine volatility in the entire 1995-2000 period to help form more realistic expectations about volatility going forward.

short-takes-investing-blog-1995-2000.png
  • The early stages of a new secular trend can be marked by low volatility and very consistent price action (see left side of chart above).
  • As the trend matures, volatility increases, telling us to mentally prepare for an increase in the red day/green day ratio over the next 12 to 24 months.
  • Even in periods that feature strong bullish trends, red days, red weeks, and red months are common.  Thus, if bullish trends continue over the next few years, none of us should be surprised when the normal and to be expected givebacks occur.
  • Higher volatility is a characteristic of late stage rallies; lower volatility is a characteristic of early-stage and more sustainable trends.  Numerous historical cases illustrate the point in a separate post
  • To capture a significant portion of the 220% gain between point A and point B above, an investor had to endure a significant amount of volatility along the way.  Volatility is not the enemy.  Our goal is not to avoid volatility, but rather to prudently discern between volatility to ignore and volatility to respect.

But, 1994-1995 Was Different  

All periods in market history are unique.  No two periods have the same combination of earnings, valuations, interest rates, inflation, geopolitics, etc.  In the chart below, was 1950 significantly different from 1982?  Of course, but the combination of factors in both periods produced extremely satisfying long-term returns for investors with a good understanding of normal market volatility.

ccm-short-takes-spx-1934-1950.png

SIGNAL:  TWO TIMES LAST 63 YEARS

Two hundred sixty-six calendar days ago, the charts told us to be open to "a life-changing rally in stocks".  Given the market has risen significantly since then, it is prudent to review the charts to examine a logical question:

IS THE HARD DATA STARTING TO SAY THIS THING IS ALMOST OVER?