Price Action YTD - What Can We Learn From History?

REFERENCE POINTS PROVIDE CONTEXT

“In strategy it is important to see distant things as if they were close and to take a distanced view of close things.”
— Miyamoto Musashi, Legendary Japanese Swordsman

A December 2016 post highlighted similarities between late 2016/early 2017 and the 1994-1995 period.  The analogy proved useful in 2017 with stocks posting a rare low-volatility year that featured a strong bullish trend, which compared very favorably with the strong-gains/low-volatility year of 1995.

EASIER MARKETS AND HARDER MARKETS

Since we know easier markets are typically followed by harder markets, it is not particularly surprising 1996 was not as easy as 1995.  Nor is it particularly surprising 2018 has been harder than 2017.  Price action in 1996 featured several bullet points investors in 2018 should easily identify with:

  • 1996 started with a gain of 10.58%
  • Stocks then dropped 11.04% and went into negative territory YTD
  • The S&P 500 dropped below an upward-sloping 200-day moving average.
short-takes-1996-correction-stock-market-1.png

WHAT HAPPENED NEXT?

After dropping below the 200-day moving average and pushing into negative territory YTD, the S&P 500 resumed its primary trend by tacking on a gain of 25.78%.  After a rough period in the first half of the year,  patient investors were rewarded with a satisfying annual gain of 20.26%

short-takes-1996-correction-stock-market.png

HOW CAN IT HELP US IN 2018?

This knowledge helps us keep an open mind about all outcomes in 2018, including better than expected outcomes.  Just as 2017 followed its own path while sharing some key characteristics with 1995, it is within the realm of possibility 2018 could feature a "harder market" in the first few months of the year and still go on to post satisfying gains when the calendar hits December 31, 2018. 

LOW VOLATILITY IS NOT BEARISH

When volatility was low in 2017 we heard "this is not normal and is thus bearish".   In 2018 we are hearing "this is too much volatility and is thus bearish".  As calendar year 1995 proves, a low-volatility year, like 2017, is not necessarily bearish.  In fact, low volatility is a sign of strong bullish conviction.  When we view the increase in volatility that took place between 1995 and 1996, the shift between 2017 and 2018 does not seem particularly abnormal; in fact, it seems to fit the strong-bullish-trend script.  We covered these "don't be surprised if volatility picks up" concepts back on January 29, 2018.

short-takes-1996-correction-stock-market-3.png

HOW OFTEN DO STOCKS VIOLATE A 50-DAY MA? .... A 100-DAY MA? ...A 200-DAY MA?

If you have a pulse, you have probably noticed bearish articles covering "major trendline breaks" involving numerous "key" technical levels, including the 50, 100, and 200-day moving averages.  To put these "bearish" signals into some real-world context, this week's video reviews the frequency of "trendline breaks" within the context of a primary bullish trend.  After reviewing the facts, you can make your own call.

BEARS HAVE AN OPEN DOOR

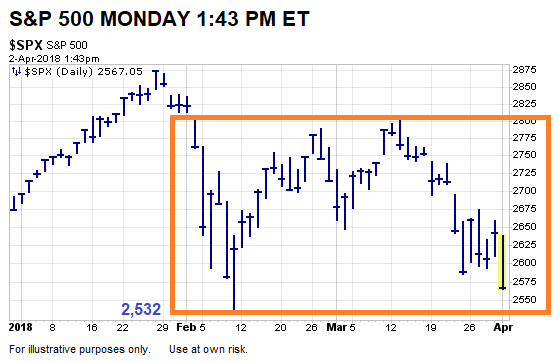
Given the vast majority of industry-related articles have leaned bearish in recent weeks, it is fairly easy to keep an open mind about an ongoing correction and/or bear market.  As outlined on April 2, a sustained S&P 500 visit below 2,532 would give the bearish case a nice boost.  It is important under our approach to remain highly flexible and open to all outcomes from wildly bullish to wildly bearish.  The markets will guide us if we are willing to listen. 
Monday's Ugly Session

TESTING THE LOWER END OF THE RANGE

The S&P 500 is approaching the lower end of the recent range.  A sustained move below 2,532 would provide additional support for the bearish case.  Comments made on March 21st and in this week's video still apply.

short-takes-April 2 2018.png

BULL/BEAR INFLECTION POINT

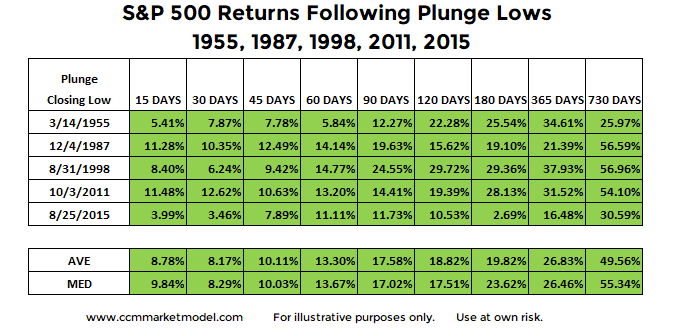
The lower end of the range represents a possible inflection point.   As noted on February 6, reversals near a prior low can be sharp (see table below).  At these levels, there is a fine line between prudent patience and prudent capital preservation. 

short-takes-April 2 2018-table.png

GAME PLAN REMAINS THE SAME

As anticipated, with price near the lower end of the range, some additional deterioration has started to show up in the hard data tracked by the model.   Like the market, the data is near an important juncture where further weakness will most likely require some allocation shifts before the end of the week.  If the market can make a stand near current levels, we will most likely be able to sit tight.  The market and the hard data will make the call. 

Tariffs May Not Slow Profit Momentum

BIG IMPACT OR SMALL IMPACT?

U.S. Treasury Secretary Steven Mnuchin indicated Sunday the U.S. is hopeful to strike a deal with China, which means the tariffs would never go into effect.  However, if a deal cannot be reached, how significant are the tariffs relative to the big picture?  From CNBC

Jeremy Zirin, head of investment strategy at UBS Wealth Management Research, told CNBC that President Trump's announcement Thursday on tariffs on up to $60 billion in Chinese imports didn't seem that bad.

"The economic impact of [the tariffs] is less than one-tenth of 1 percent," Zirin told "Squawk Box."

"It's actually pretty bullish what we heard yesterday," he added. "If you look at the steel and aluminum tariffs as a template, things got watered down and then scaled back. So, if you look at the whole economic backdrop, still a very good profit momentum."

TWENTY-YEAR BREAKOUT

From a bigger picture perspective, the economy does not appear to be on the brink of a recession and the 20-year breakout in the Value Line Geometric Index is still in play.  

short-takes-ciovacco-xvg-22a.png

AN OBJECTIVE LOOK AT THE MARKET AFTER FRIDAY'S SELL-OFF

Last week was ugly in the stock market.  If we put normal human emotions aside and examine the facts, what can we learn about the odds of a new bear market relative to the odds of a resumption of the current bull market?  

BULLISH TREND, FOLLOWED BY CONSOLIDATION

The stock market was unequivocally in a long-term bullish trend prior to the recent correction.  As noted on March 21, the S&P 500 has drifted within a wide range since February 2, including last Friday's volatile session.  As long as a sustained break of the lower end of the range does not occur (something that is entirely possible), the base case remains a normal correction within the context of an existing bull market.  If a series of lower lows, below the lower end of the range, is in the cards,  we must become open to more bearish outcomes.