This Never Happened In The 1974, 2001, and 2008 Bear Markets

JANUARY CLOSE PROVIDES INSIGHT

The chart below shows the S&P 500 closed above the monthly Bollinger Band centerline (a.k.a. center band) on January 31, 2019. The January print occurred after the S&P 500 closed below the centerline in December, but above the lower Bollinger Band.

BB 2019.png

1973-74 BEAR MARKET

As shown in the 1973-74 version of the same chart, notice how the S&P 500 was unable to recapture and close above the Bollinger Band centerline during the entire bear market. Unlike the 2019 case (thus far), the S&P 500 closed below the lower Bollinger Band in November 1973.

short-takes-ciovacco-bb6.png

DOT-COM BEAR MARKET

The same can be said for the 2000-02 bear market; the S&P 500 never closed back above the Bollinger Band centerline after closing below it in Q4 2000. As shown below, really bad things happened after Q4 2000. Unlike the 2019 case, the S&P 500 closed below the lower Bollinger Band in February 2001.

BB 2000.png

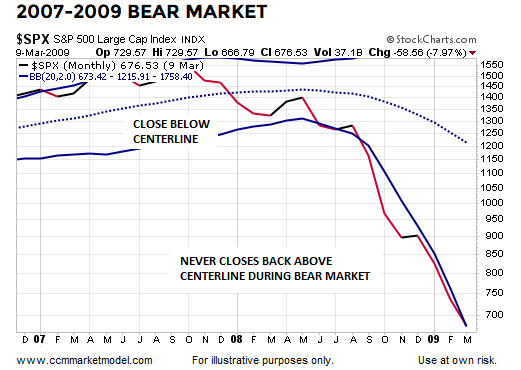
FINANCIAL CRISIS BEAR MARKET

After stocks peaked in October 2007, the S&P 500 closed below the monthly Bollinger Band centerline in January 2008 and never closed back above it during the painful bear market. Unlike the 2019 case, the S&P 500 closed below the lower Bollinger Band in June 2008.

BB 2007.png

2019 LOOK IS RARE

It is relatively rare for the S&P 500 to move from above the monthly Bollinger Band centerline, close below the centerline while remaining above the lower Bollinger Band, and subsequently print a monthly close back above the centerline, which is what just happened in 2018-2019.

Dating back to 1950, there were thirteen similar looks that appeared on the S&P 500’s monthly chart. As shown in the table below, the bias for stocks over the next two years was favorable.

short-takes-bollingerbands-mm-b.png

CASES WITH BREADTH THRUSTS

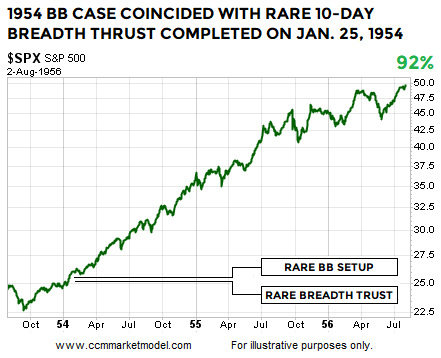
The monthly Bollinger Band setup described above is rare. It is interesting to note that two of the Bollinger band cases, 1954 and 1991, basically coincided with an extremely rare 10-day breadth thrust that was covered on January 21, 2019. Therefore, we have three cases that feature both the Bollinger Band setup and rare breadth thrust: 1954, 1991, and 2019.

The look of the monthly chart on the last trading day of January 1954 is similar to the rare look found at the end of January 2019.

short-takes-bb-1991-2B.png

The ten-day breadth thrust was completed on January 25, 1954, four trading days before the monthly Bollinger Band setup went into the books. Similar to 2019, price was near a flat-to-downish orange 200-day moving average.

short-takes-bb-1954-B2.png

The 1954 case that featured both setups was followed by very satisfying gains in the S&P 500 Index.

short-takes-ciovacco-capital-spx-1991-btC.png

1991 DUAL SETUP CASE

The look of the monthly chart on the last trading day of January 1991 is similar to the rare look found at the end of January 2019.

short-takes-bb-1991-2.png

The ten-day breadth thrust was completed on February 4, 1991, or two trading days after the monthly Bollinger Band setup went into the books. Similar to 2019, price was near a flat-to-downish orange 200-day moving average.

short-takes-bb-1991-B2.png

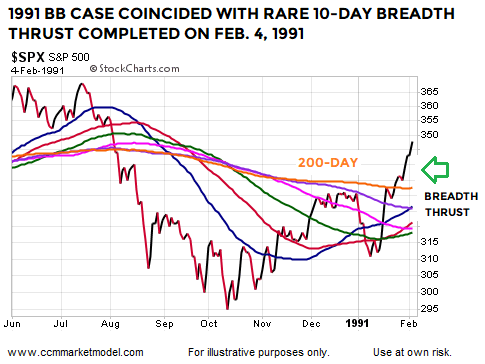
The 1991 case that featured both setups was followed by very satisfying gains in the S&P 500 Index.

short-takes-ciovacco-capital-spx-1991-btB.png

DIGGING DEEPER

This week’s stock market video covers numerous historical cases that provide additional insight into the 2019 bull/bear debate.

2015: WEAKER TRENDS ARE MORE PRONE TO FAILURE

The 2015 Bollinger Band case reminds us a significant giveback remains a possibility in 2019. The 2015 monthly BB setup was unable to hold above the centerline and turned out to be a head fake.

short-takes-bb-2015-A.png

Two other reminders come from the 2015 case:

Markets with still-vulnerable trend profiles are more prone to reversals, givebacks, and setup failures.

Closing above the orange 200-day moving average is far from an “all clear” signal in the stock market. In 2015, the S&P 500 closed above the 200-day for eight trading sessions, before falling 13.30%.

SPXCCV67B.png

MORAL OF THE STORY

Having something concrete and measurable that differentiates 2018-2019 from three of the greatest percentage-decline bear markets in history (73-74, 00-02, 07-09) speaks favorably to bull/bear probabilities in February 2019.

However, the 1957 and 2015 cases remind us head fakes and lower lows are still in the realm of possibility. In those periods, the stay above the monthly Bollinger Band centerline was short lived, meaning intermediate-term concerns would increase in 2019 if the S&P 500 prints a monthly close back below the Bollinger Band centerline, which currently sits at 2685.

What Does History Tell Us About Weak Profiles Near The 200-Day?

NOT ALL MOVES ABOVE THE 200-DAY ARE CREATED EQUAL

As the historical examples below clearly demonstrate, after a plunge in the stock market and within the context of a still weak long-term trend profile, seeing the S&P close above its 200-day moving average is far from an “all clear” signal. As covered in recent CCM weekly videos and shown below, the S&P 500 traded above its 200-day after making a low in October 2011.

short-takes-2-11-2018-spx-2015-3.png

WEAK TRENDS AND MOVES ABOVE THE 200-DAY

The CCM Trend Strength Model is major component of the CCM Market Model. Trend strength scores are based on 207 binary questions using data from multiple timeframes. In late October 2011, the S&P 500 closed above a flattish 200-day moving average. However, the trend strength (TS) score was only 9 on a scale of 0 to 100, with 100 being the strongest. With a TS score of 9, the S&P 500 failed to hold above the 200-day and subsequently dropped 9.84%. The TS score of 9 told us the market’s longer-term trend still had some work to do before allowing for a more favorable risk-reward setup. When the market was ready to put together a sustained rally, the TS score was sitting at 82 in late December 2011.

short-takes-2-11-2018-spx-2015-6.png

TRENDS TYPICALLY NEED TIME TO FLIP

A similar situation occurred following a plunge in 2015; the S&P 500 rallied sharply back to the 200-day moving average.

short-takes-2-11-2018-spx-2015.png

CLOSER LOOK AT 2015 CASE

The initial push above the orange 200-day in 2015 was marked by eight trading days of gains before the market started to drop back toward the moving average cluster (chart below). The S&P 500 closed 2.41% above the point where it crossed the 200-day, telling us short stays and relatively tame moves above the 200-day are not necessarily “everything is fine” signals. Price stayed near the 200-day for seventy-one calendar days.

short-takes-2-11-2018-spx-2015-2.png

Similar to the 2011 case, the initial push above the 200-day occurred within the context of a relatively weak TS score of 17. From the highest close above the 200-day in early November 2015, the S&P 500 dropped 13.30% and exceeded the previous plunge low that was made in 2015. Notice how the S&P 500 was trading near 2100 in November 2015.

short-takes-2-11-2018-spx-2015-7.png

WEAK PROFILES CAN LEAD TO SIDEWAYS MOVEMENT

While it would have been easy to say “we are going to be left behind” as the S&P 500 rallied sharply off the initial plunge low in 2015 and made it all the way back to 2100, the market was still trying to clear 2100 in July of the following year. When the market was in a position to put together a more stable and sustainable rally (right side below), the TS score was sitting at 100, which is quite a bit more attractive from a risk-reward perspective relative to the TS score of 17 after the first push above the 200-day in 2015.

short-takes-2-11-2018-spx-2015-9.png

FAVORABLE RISK-REWARD SETUPS vs. UNFAVORABLE SETUPS

TS scores cannot predict the future; they simply help us assess the odds of good things happening on a longer-term basis relative to the odds of bad things happening on a longer-term basis. Does the 2019 TS score look more like the “take a measured approach” scores of 9 and 17 that were present before rallies failed in 2011 and 2015 or does the present score look more like the “this is a much more attractive risk/reward profile” scores of 82 and 100 that were present before satisfying and sustained moves higher in the stock market? The S&P 500’s TS score during the trading session on Monday, February 11, 2019 was 7, which is much more in line with the “take a measured approach” scores.

short-takes-2-11-2018-spx-2015-11.png

UPDATING SIMILAR HISTORICAL SETUPS

This week’s stock market video updates recent historical cases covered in previous videos. The video opens with a review of some of the most significant corrections and bear markets, allowing us to better understand what is in the realm of possibility over the next twenty years.

LOW PROBABILITY IS FAR FROM ZERO PROBABILITY

When using probability models to assess any situation, humans tend to equate very low probability outcomes with something that cannot or will not happen (see 2016 U.S. presidential election).  Therefore, it is important to understand a low probability outcome is radically different from a zero probability outcome, and thus, the need for maximum flexibility going forward.

SPEAKS TO NEXT FEW MONTHS RATHER THAN NEXT FEW DAYS/WEEKS

Q: With a TS score of 7, is it possible the market continues to rally sharply and confidently moves above the 200-day moving average?

A: Yes, anything is possible in the markets and we are prepared for all outcomes from wildly bullish to wildly bearish. The TS score speaks to risk-vs.-reward. A recent similar breadth thrusts piece covered a V-bottom that occurred in 1971. In the 1971 case, the S&P blew through the 200-day and never looked back. The TS score after clearing the 200-day was 38, which is still considerably higher than the score of 7 we are seeing today. The moral of the 1971 story is we should be open to and prepared for bullish outcomes near the 200-day in 2019.

short-takes-2-11-2018-spx-2015-15.png

Q: Will the 2019 rally fail soon?

A: Under our approach, it is best to take it day by day with an open mind and see how the data evolves over time. Even in a giveback or retest scenario, the 2011 and 2015 cases remind us the market could trade near the 200-day for several weeks before anything is resolved.

short-takes-2-11-2018-spx-2015-13.png

Q: What is the key point relative to our approach to the markets?

A: The key takeaway for us is making prudent risk-reward decisions with our hard-earned capital. The S&P 500’s 200-day moving average is sitting at 2743. Anecdotally, an S&P 500 push 2.41% above the 200-day, similar to 2015, would land at 2809. From that point in 2015, the S&P 500 dropped 13.30%. Even a 50% retracement of the V-move off the December 2018 low would mean a giveback of 6.2%; a move back to the 61.8% level would mean an S&P 500 drop of 7.90%. A full retest of the December 2018 low could mean a drop somewhere in the neighborhood of 13%.

ciovacco-short-takes-blog-99a.png

With a TS score below 10 and a still yet-to-be determined outcome near the S&P 500’s 200-day, we will continue to take a prudent, patient, and measured approach. We will continue to scale in at a rate in line with the rate of improvement in the hard data. If the data begins to improve at a faster rate, we will begin to take larger incremental steps.

This post is written for clients of Ciovacco Capital Management and describes our approach in generic terms. It is provided to assist clients with basic concepts, rather than specific strategies or levels. The same terms of use disclaimers used in our weekly videos apply to all Short Takes posts and tweets on the CCM Twitter Feed, including the text and images above.