
THIRD CONSECUTIVE MONTHLY CLOSE
As described in detail below, when the S&P 500 closed above the monthly Bollinger Band centerline at the end of January, it aligned the present day with favorable historical probabilities and also provided some distance from setups in the 1974, 2001, and 2008 bear markets.
The end of March 2019 brought the third consecutive monthly S&P 500 close above the monthly Bollinger Band centerline. Twelve of the thirteen similar historical cases, covered on February 19, also went on to print three consecutive closes above the monthly Bollinger Band centerline; the exception was the 6/30/1960 case, which gave up the centerline in the second month. The table below shows S&P 500 performance in the remaining twelve historical cases following the third consecutive close above the monthly Bollinger Band centerline (similar to what occurred at the end of March 2019).
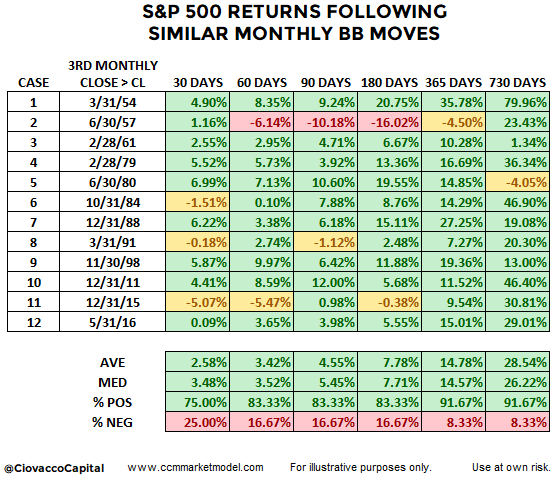
From a longer-term perspective, three things jump off the table above:
The 1957 case reminds us to keep an open mind about all outcomes, including another significant pullback in the S&P 500.
The odds favor satisfying gains over the next two years with tolerable drawdowns and pullbacks. Over 90% of the historical cases posted positive returns looking out one to two years.
To capture the historical returns above, investors had to endure normal bouts of market volatility and emotional swings from time to time. This analysis tells us very little about the next three hours or three days.
JANUARY CLOSE PROVIDED INSIGHT
The chart below shows the S&P 500 closed above the monthly Bollinger Band centerline (a.k.a. center band) on January 31, 2019. The January print occurred after the S&P 500 closed below the centerline in December, but above the lower Bollinger Band.

1973-74 BEAR MARKET
As shown in the 1973-74 version of the same chart, notice how the S&P 500 was unable to recapture and close above the Bollinger Band centerline during the entire bear market. Unlike the 2019 case (thus far), the S&P 500 closed below the lower Bollinger Band in November 1973.

DOT-COM BEAR MARKET
The same can be said for the 2000-02 bear market; the S&P 500 never closed back above the Bollinger Band centerline after closing below it in Q4 2000. As shown below, really bad things happened after Q4 2000. Unlike the 2019 case, the S&P 500 closed below the lower Bollinger Band in February 2001.

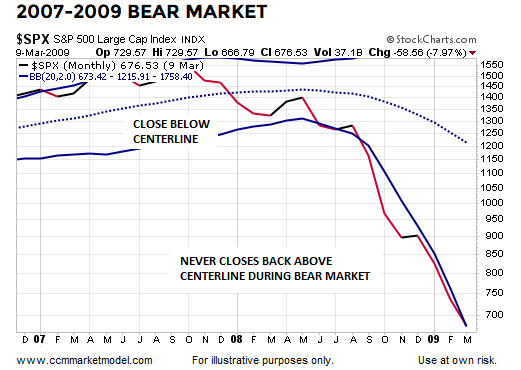
FINANCIAL CRISIS BEAR MARKET
After stocks peaked in October 2007, the S&P 500 closed below the monthly Bollinger Band centerline in January 2008 and never closed back above it during the painful bear market. Unlike the 2019 case, the S&P 500 closed below the lower Bollinger Band in June 2008.
WHAT DOES HISTORY SAY ABOUT THE RECENT INVERSION IN THE YIELD CURVE?
On Friday, March 22, the shorter end of the yield curve inverted, prompting analysis and commentary that heavily slanted toward bearish economic and market outcomes.

This week’s stock market video takes a look at every single case of similar yield curve inversion dating back to 1982 and shows exactly what happened in the stock market over the following year. After reviewing the facts, you can draw your own conclusions.
JANUARY 2019 LOOK WAS RARE
It is relatively rare for the S&P 500 to move from above the monthly Bollinger Band centerline, close below the centerline while remaining above the lower Bollinger Band, and subsequently print a monthly close back above the centerline, which is what just happened in 2018-2019.
Dating back to 1950, there were thirteen similar looks that appeared on the S&P 500’s monthly chart. As shown in the table below, the bias for stocks over the next two years was favorable. The table below appeared in the original February post and aligns with the 2019 market as of 1/31/2019.

CASES WITH BREADTH THRUSTS
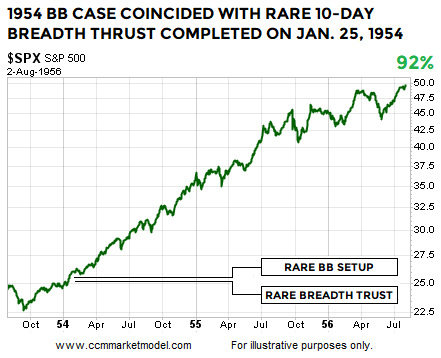
The monthly Bollinger Band setup described above is rare. It is interesting to note that two of the Bollinger band cases, 1954 and 1991, basically coincided with an extremely rare 10-day breadth thrust that was covered on January 21, 2019. Therefore, we have three cases that feature both the Bollinger Band setup and rare breadth thrust: 1954, 1991, and 2019.
The look of the monthly chart on the last trading day of January 1954 is similar to the rare look found at the end of January 2019.

The ten-day breadth thrust was completed on January 25, 1954, four trading days before the monthly Bollinger Band setup went into the books. Similar to 2019, price was near a flat-to-downish orange 200-day moving average.

The 1954 case that featured both setups was followed by very satisfying gains in the S&P 500 Index.
1991 DUAL SETUP CASE
The look of the monthly chart on the last trading day of January 1991 is similar to the rare look found at the end of January 2019.

The ten-day breadth thrust was completed on February 4, 1991, or two trading days after the monthly Bollinger Band setup went into the books. Similar to 2019, price was near a flat-to-downish orange 200-day moving average.
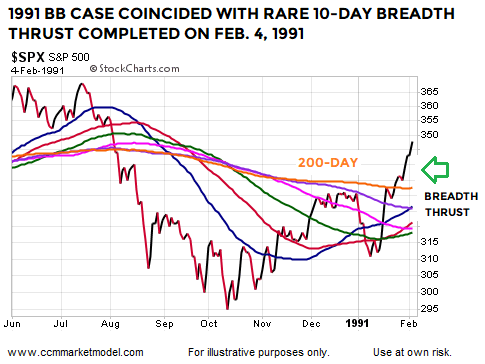
The 1991 case that featured both setups was followed by very satisfying gains in the S&P 500 Index.

2015: WEAKER TRENDS ARE MORE PRONE TO FAILURE
The 2015 Bollinger Band case reminds us a significant giveback remains a possibility in 2019. The 2015 monthly BB setup was unable to hold above the centerline and turned out to be a head fake.

Two other reminders come from the 2015 case:
Markets with still-vulnerable trend profiles are more prone to reversals, givebacks, and setup failures.
Closing above the orange 200-day moving average is far from an “all clear” signal in the stock market. In 2015, the S&P 500 closed above the 200-day for eight trading sessions, before falling 13.30%.

MORAL OF THE STORY
Having something concrete and measurable that differentiates 2018-2019 from three of the greatest percentage decline bear markets in history (73-74, 00-02, 07-09) speaks favorably to bull/bear probabilities in 2019.
However, the 1957 and 2015 cases remind us head fakes and lower lows are still in the realm of possibility. In those periods, the stay above the monthly Bollinger Band centerline was short lived, meaning intermediate-term concerns would increase in 2019 if the S&P 500 prints a monthly close back below the Bollinger Band centerline, which currently sits at 2723.