
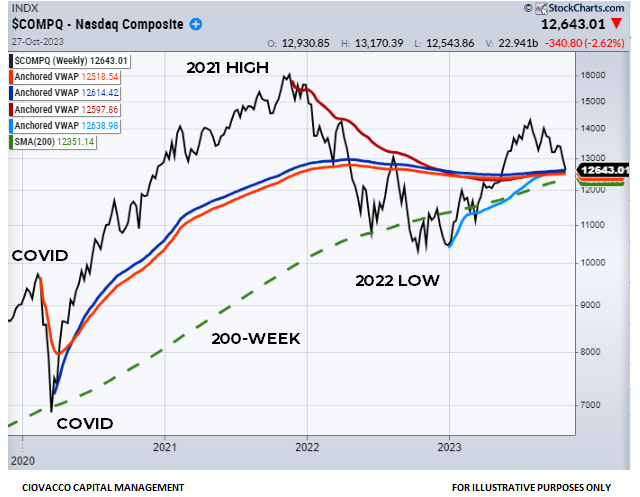
Cluster of Possible Support
The NASDAQ Composite’s anchored volume weighted average price (AVWAP) chart below, as of Friday’s close, says the market is at a very important juncture. It would be logical for buyers to become interested near the intersection of the AVWAPs tied to the COVID high, COVID low, 2021 high, 2022 low, and 200-day moving average. The fact that these levels were held on Friday, October 27, allowed for some prudent patience heading into Fed week. If buyers fail to step in at the critical juncture below and price fails to hold near the cluster of possible support, concerns would increase.
The table below shows where the NASDAQ finished last week in relation to the important areas shown on the chart above. The table is shaded in green to represent support levels that were still in play as of Friday, October 27. We will learn something about bullish odds if the NASDAQ makes a stand this week, just as we will learn something about bearish odds if price cannot hold support. If support is violated, the longer below, the more concerning it would become.

Important Levels for SPY
The weekly AVWAP chart for the SPDR S&P 500 ETF (SPY) also shows several areas of possible support below the closing price on Friday, October 27.

The fact that price remained above the AVWAP lines tied to the January 2022 high and October 2022 low told us that there was still a reasonable basis to believe the 2022-2023 rally was still intact. The 200-week moving average provides a reference point relative to the status of the market’s secular trend, which also remains intact.

S&P 1500: Hanging In There
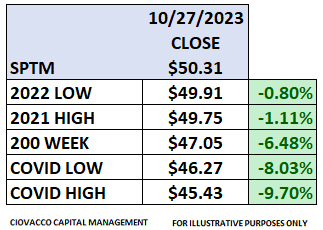
Like SPY and the NASDAQ Composite Index, the S&P 1500 ETF (SPTM) has some important bull/bear reference points in close proximity to the closing price on Friday, October 27, allowing for some risk-management patience to see how things unfold in the coming days and weeks.

SPTM has the AVWAP lines from the 2021 high and 2022 low less than 2% below the closing level on Friday, October 27. If price can make a stand this week, the further it pushes above these levels, the higher the odds the 2022-2023 stock market rally is still intact. If price fails to hold the black and red lines in the chart above, it would speak to increasing bearish odds.
RSP: A More Troubling Look
Areas of possible support provide logical bull/bear points of reference. If support holds, we learn something. If support breaks, that also provides valuable information. Unlike the NASDAQ and ETFs covered above, the Equal-Weight S&P 500 ETF (RSP) has dropped below numerous important levels, including the AVWAP lines ties to the COVID high, COVID low, 2021 high, and 2022 low. The longer price remains below these levels, the more concerning it becomes.

The red portions of the RSP table below indicate important levels that were not being held as of the close on Friday, October 27. If RSP can recapture these levels in the coming days and weeks, it would be a good sign for the bullish case. That may happen soon, but it was not the case heading into this week. The good news is RSP still has some very relevant AVWAP levels in the area tied to the major highs and lows in 2018. RSP also was holding above an upward-sloping 200-week as of the close on Friday, October 27.

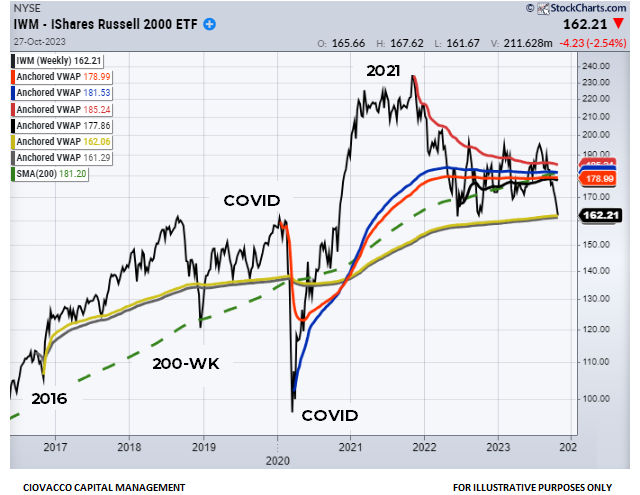
Small Caps: 2016 Election Levels
As shown in the chart below, the Russel 2000 Small Cap ETF (IWM) has given up an important cluster of possible support and has moved back to important AVWAP levels tied to the pre-2016 election high and low (black and mustard lines). IWM held above these lines in 2022; it would be concerning if it drops below them in 2023.
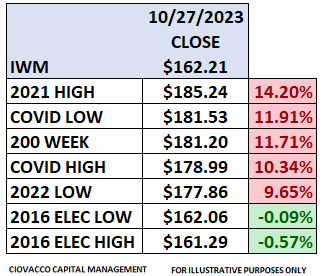
The red portions of the table below fall on the concerning side of the bull/bear ledger. The green portions say IWM needs to make a stand during Fed week. The good news is IWM has made stands numerous times above the black and mustard lines since late 2016 (see chart above).
Is It Now or Never For JNK?
The SPDR Barclay’s High Yield Bond ETF (JNK) has thus far held above the black AWAP line tied to the 2022 low. Notice how JNK remained above the black line during pullbacks in Q4 2022 and Q1 2023. If the black line continues to act as support, this would be good news relative to the odds of an imminent recession or debt crisis sparked by runaway government spending in the United States.

When you consider the enormous amount of government stimulus pumped into the system over the past three years, it is concerning that JNK failed to make a stand at the AVWAP lines tied to the COVID high and COVID low. To recapture those levels, JNK would need to rally back above $90.05; it closed last Friday at $88.61.

Reference Points Rather Than Predictions
The levels shown on the charts above serve as logical reference points to assist with a prudent IF/THEN contingency plan. Last Friday, we had evidence of troubling deterioration on the charts of RSP, IWM, and JNK. Near the close on Friday, October 27 we also had numerous “keep an open mind about better-than-expected outcomes” forms of possible support on the charts of the NASDAQ Composite, SPY, and SPTM.
If SPY, SPTM, and the NASDAQ can make stands this week and hold above the important levels outlined above, the odds of the 2022-2023 rally resuming would improve. Conversely, if SPY, SPTM and the NASDAQ follow RSP, IWM, and JNK and begin to break below important bull/bear levels, the odds of additional downside will increase.