Tracking The Stock Market's Progress Versus Historical Cases

STUDY UPDATE

A March 1 analysis covered historical cases similar to the 2019 setup shown below, where the S&P 500’s 100-day moving average (blue) dropped below a flattish-to-down 200-day (red). Stocks rallied and the market closed above the 200-day for eleven consecutive trading days.

short-takes-ciovacco-os-1.png

If we fast forward to April 3, 2019, the S&P 500 only closed below the 200-day twice during the period spanning thirty-six trading days. A ratio of 2/36 speaks to limited selling pressure.

short-takes-ciovacco-capital-200-avb.png

HISTORICAL CASES

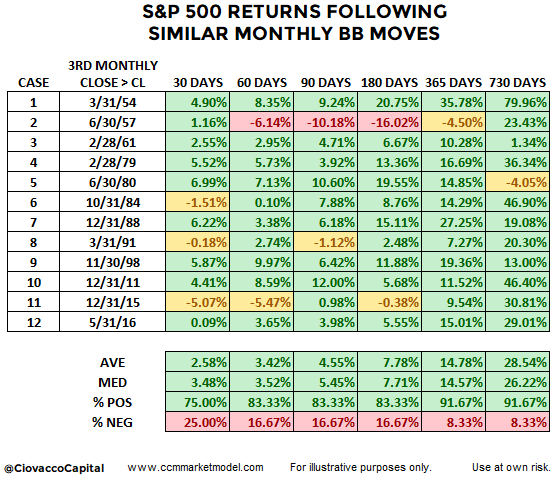
The tables below provide a “walk forward” update to the same cases covered in the original March study. Our goal in the updated study was to see how the stock market performed in the historical cases taking into account the number of daily closes below the 200-day in the same thirty-six trading day window.

The strongest cases are shown in group one. In each instance, the number of closes below the 200-day in the thirty-six day period was five or less (column three below). The 2019 case fits into group one since there were only two closes below the 200-day in the thirty-six day window.

ciovacco-short-takes-table-a8.png

The second group features cases with weaker evidence over the thirty-six trading day study period. In group two, selling conviction was strong enough to create between eight and twenty-two closes below the 200-day (third column table below).

ciovacco-short-takes-blog-group-b3.png

As we might expect, group one performance (stronger trends) was noticeably better than group two (weaker trends). In group one looking out one year, the average S&P 500 gain was 12.92% and 94% of the eighteen cases featured positive returns. Group two cases produced an average loss of 13.70% after one year, with only one profitable case. We can learn a lot about the market’s present-day health by tracking and observing present-day facts; a concept that is quite a bit different from attempting to predict or forecast an uncertain future.

LONG-TERM DOWNTRENDS

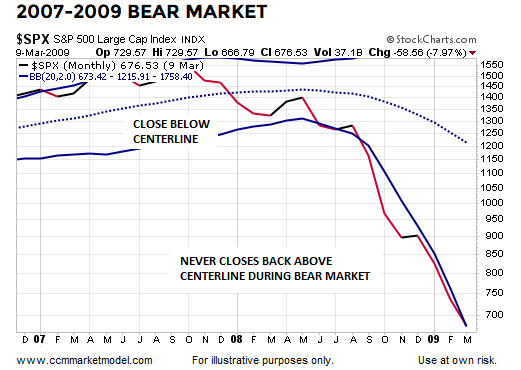
Some basic concepts regarding trends shed additional light on the data above. Lower probability markets tends to stay below their 200-day moving average and often feature a downward-sloping 200-day.

ciovacco-capital-short-takes-apr-7-2019-1.png

INDECISIVE AND HEALTHY TRENDS

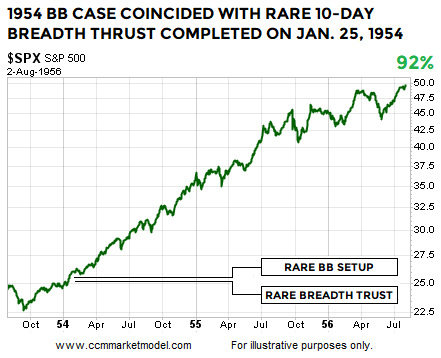
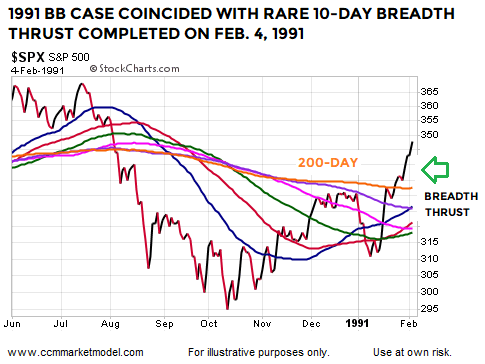
Indecisive or range-bound markets tend to feature flattish moving averages and price oscillating above and below the moving averages (left side of chart below). Healthy and sustainable long-term trends tend to feature a high percentage of trading days that close above the 200-day (right side of chart below). Thus, the longer a market can stay above the 200-day in the early stages of a rally attempt, the higher the odds we are dealing with a new trend rather than a countertrend move that will be followed by lower lows. In 2019, the S&P 500 is trying to transition from the flattish/indecisive stage to the upward-sloping/higher-conviction stage.

short-takes-ciovacco-flattish-a.png

NEW S&P 500 STUDY (1950-2019)

This week’s stock market video covers a recent rare setup on the weekly chart of the S&P 500 and subsequent stock market performance looking out three years.

DAY BY DAY

Thus far, selling pressure has not been strong enough to push and hold the S&P 500 below the 200-day moving average. Should fundamental issues come to light that create a shift in sentiment resulting in a prolonged stay below the 200-day, 2019 odds would begin to deteriorate in a bearish manner. We will continue to take it day by day open to all outcomes.

Updating January's Rare S&P 500 Setup

THIRD CONSECUTIVE MONTHLY CLOSE

As described in detail below, when the S&P 500 closed above the monthly Bollinger Band centerline at the end of January, it aligned the present day with favorable historical probabilities and also provided some distance from setups in the 1974, 2001, and 2008 bear markets.

The end of March 2019 brought the third consecutive monthly S&P 500 close above the monthly Bollinger Band centerline. Twelve of the thirteen similar historical cases, covered on February 19, also went on to print three consecutive closes above the monthly Bollinger Band centerline; the exception was the 6/30/1960 case, which gave up the centerline in the second month. The table below shows S&P 500 performance in the remaining twelve historical cases following the third consecutive close above the monthly Bollinger Band centerline (similar to what occurred at the end of March 2019).

short-takes-ciovacco-bb-setups2.png

From a longer-term perspective, three things jump off the table above:

  • The 1957 case reminds us to keep an open mind about all outcomes, including another significant pullback in the S&P 500.

  • The odds favor satisfying gains over the next two years with tolerable drawdowns and pullbacks. Over 90% of the historical cases posted positive returns looking out one to two years.

  • To capture the historical returns above, investors had to endure normal bouts of market volatility and emotional swings from time to time. This analysis tells us very little about the next three hours or three days.

JANUARY CLOSE PROVIDED INSIGHT

The chart below shows the S&P 500 closed above the monthly Bollinger Band centerline (a.k.a. center band) on January 31, 2019. The January print occurred after the S&P 500 closed below the centerline in December, but above the lower Bollinger Band.

BB 2019.png

1973-74 BEAR MARKET

As shown in the 1973-74 version of the same chart, notice how the S&P 500 was unable to recapture and close above the Bollinger Band centerline during the entire bear market. Unlike the 2019 case (thus far), the S&P 500 closed below the lower Bollinger Band in November 1973.

short-takes-ciovacco-bb6.png

DOT-COM BEAR MARKET

The same can be said for the 2000-02 bear market; the S&P 500 never closed back above the Bollinger Band centerline after closing below it in Q4 2000. As shown below, really bad things happened after Q4 2000. Unlike the 2019 case, the S&P 500 closed below the lower Bollinger Band in February 2001.

BB 2000.png

FINANCIAL CRISIS BEAR MARKET

After stocks peaked in October 2007, the S&P 500 closed below the monthly Bollinger Band centerline in January 2008 and never closed back above it during the painful bear market. Unlike the 2019 case, the S&P 500 closed below the lower Bollinger Band in June 2008.

BB 2007.png

WHAT DOES HISTORY SAY ABOUT THE RECENT INVERSION IN THE YIELD CURVE?

On Friday, March 22, the shorter end of the yield curve inverted, prompting analysis and commentary that heavily slanted toward bearish economic and market outcomes.

yield-curve-inversion-ciovacco.png

This week’s stock market video takes a look at every single case of similar yield curve inversion dating back to 1982 and shows exactly what happened in the stock market over the following year. After reviewing the facts, you can draw your own conclusions.

JANUARY 2019 LOOK WAS RARE

It is relatively rare for the S&P 500 to move from above the monthly Bollinger Band centerline, close below the centerline while remaining above the lower Bollinger Band, and subsequently print a monthly close back above the centerline, which is what just happened in 2018-2019.

Dating back to 1950, there were thirteen similar looks that appeared on the S&P 500’s monthly chart. As shown in the table below, the bias for stocks over the next two years was favorable. The table below appeared in the original February post and aligns with the 2019 market as of 1/31/2019.

short-takes-bollingerbands-mm-b.png

CASES WITH BREADTH THRUSTS

The monthly Bollinger Band setup described above is rare. It is interesting to note that two of the Bollinger band cases, 1954 and 1991, basically coincided with an extremely rare 10-day breadth thrust that was covered on January 21, 2019. Therefore, we have three cases that feature both the Bollinger Band setup and rare breadth thrust: 1954, 1991, and 2019.

The look of the monthly chart on the last trading day of January 1954 is similar to the rare look found at the end of January 2019.

short-takes-bb-1991-2B.png

The ten-day breadth thrust was completed on January 25, 1954, four trading days before the monthly Bollinger Band setup went into the books. Similar to 2019, price was near a flat-to-downish orange 200-day moving average.

short-takes-bb-1954-B2.png

The 1954 case that featured both setups was followed by very satisfying gains in the S&P 500 Index.

short-takes-ciovacco-capital-spx-1991-btC.png

1991 DUAL SETUP CASE

The look of the monthly chart on the last trading day of January 1991 is similar to the rare look found at the end of January 2019.

short-takes-bb-1991-2.png

The ten-day breadth thrust was completed on February 4, 1991, or two trading days after the monthly Bollinger Band setup went into the books. Similar to 2019, price was near a flat-to-downish orange 200-day moving average.

short-takes-bb-1991-B2.png

The 1991 case that featured both setups was followed by very satisfying gains in the S&P 500 Index.

short-takes-ciovacco-capital-spx-1991-btB.png

2015: WEAKER TRENDS ARE MORE PRONE TO FAILURE

The 2015 Bollinger Band case reminds us a significant giveback remains a possibility in 2019. The 2015 monthly BB setup was unable to hold above the centerline and turned out to be a head fake.

short-takes-bb-2015-A.png

Two other reminders come from the 2015 case:

Markets with still-vulnerable trend profiles are more prone to reversals, givebacks, and setup failures.

Closing above the orange 200-day moving average is far from an “all clear” signal in the stock market. In 2015, the S&P 500 closed above the 200-day for eight trading sessions, before falling 13.30%.

SPXCCV67B.png

MORAL OF THE STORY

Having something concrete and measurable that differentiates 2018-2019 from three of the greatest percentage decline bear markets in history (73-74, 00-02, 07-09) speaks favorably to bull/bear probabilities in 2019.

However, the 1957 and 2015 cases remind us head fakes and lower lows are still in the realm of possibility. In those periods, the stay above the monthly Bollinger Band centerline was short lived, meaning intermediate-term concerns would increase in 2019 if the S&P 500 prints a monthly close back below the Bollinger Band centerline, which currently sits at 2723.