
Are Institutions Selling Into This Rally?
SIGNS OF WEAKNESS - MARCH 2000
The weekly chart below shows NYSE volume associated with advancing issues less volume associated with declining issues (NYUD). During the topping process in 1999-2000, notice how NYUD made a discernible lower high relative to the S&P 500’s higher high in March 2000.

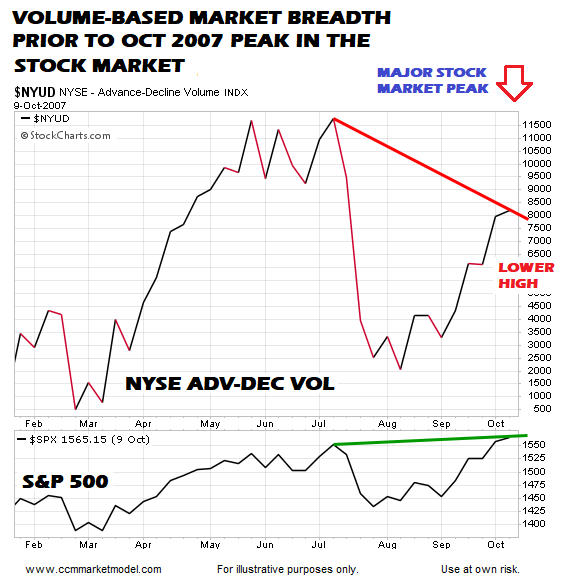
SIGNS OF WEAKNESS - OCTOBER 2007
In October 2007, the S&P 500 printed a new high and NYUD printed a discernible lower high, an indication the broad NYSE Index was showing some signs of internal weakness.
HOW DOES THE SAME CHART LOOK TODAY?
Weekly NYSE advance - decline volume printed a higher high in April 2019 that exceeded the September 2018 high. Last week, NYUD printed another higher high by exceeding the April 2019 high. Market breadth was waving yellow “pay closer attention” flags in both 2000 and 2007. Thus far, the same warning flags are not waving in 2019. We use the chart below to monitor the market’s current risk-reward profile, which is significantly different from using it to forecast, project, or predict. It is quite possible market breadth will shift in a negative manner in the coming weeks. Thus far, it still looks constructive.

DOES THE BIG PICTURE SUPPORT A TRIPLE TOP?
This week’s stock market video shows how the laws of supply and demand can be used to better understand Fed policy, credit spreads, and the market’s current risk-reward profile.
CURRENT READ OF FINANCIAL CONDITIONS
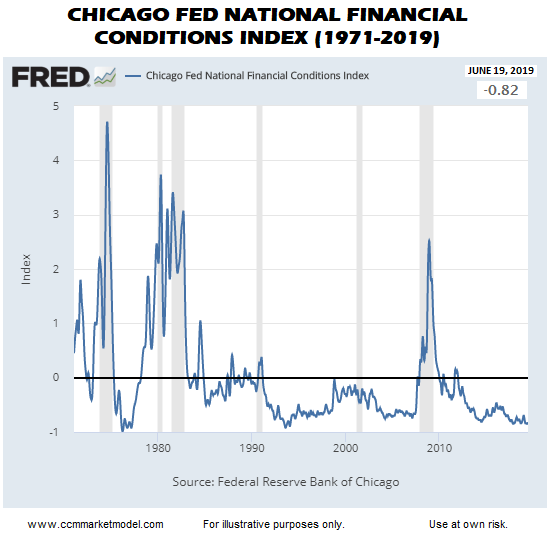
The Chicago Fed National Financial Conditions Index allows us to better understand the present day in the context of economic and stock market history. A description of the index is helpful prior to reviewing the chart below:
“A comprehensive weekly update on U.S. financial conditions in money markets, debt and equity markets and the traditional and shadow banking systems. Positive values of the NFCI indicate financial conditions that are tighter than average, while negative values indicate financial conditions that are looser than average.”
Notice how the index (chart below) tends to gravitate toward the centerline prior to recessions and bear markets. Present-day readings remain firmly in “looser than average” territory, meaning financial conditions, like market breadth, are not currently waving yellow flags for the economy and stock market. The financial conditions index is a helpful monitoring tool rather than a forecasting tool. Concerns would increase if the index begins to rise rapidly as it did in the second half of 2007.
LONG-TERM TRENDS: 2000 vs. 2007 vs. 2019
You can make an argument large institutions were selling stocks near the 200-week moving average after the 2000 and 2007 stock market peaks (top two charts below). Recent activity near the 200-week looks more like the institutional buying support that took place near the lows in 2016 (third chart below).

Similar concepts were covered on a shorter timeframe in a recent 100/300-day moving average study.
FED CUTS IN A NON-RECESSIONARY ENVIRONMENT
Last week’s video made the case the present day economy remains in expansion mode and demonstrated good things tended to happen in the S&P 500 after a first rate cut in a non-recessionary environment. Markets are expecting the first Fed cut in July; if so, it may help offset the trend of weaker economic data.

TRADE REMAINS THE BEARISH WILD CARD
Given the complexity of any trade agreement between the United States and China, it is highly unlikely any binding agreements will be made at this weekend’s G-20 meeting. Thus, markets will most likely move based on signs of escalation versus signs of getting back to the negotiation table.
With ongoing trade and tariff uncertainty, it is very difficult for businesses to make long-term hiring and capital expenditure decisions. If this drag continues and trade tensions escalate in the coming days, weeks, and months, it would not be surprising to see the charts above deteriorate in a meaningful manner. Therefore, we must remain open to a wide range of future outcomes, from wildly bullish to wildly bearish. We will continue to take it day by day.
This post is written for clients of Ciovacco Capital Management and describes our approach in generic terms. It is provided to assist clients with basic concepts, rather than specific strategies or levels. The same terms of use disclaimers used in our weekly videos apply to all Short Takes posts and tweets on the CCM Twitter Feed, including the text and images above.
Is The Stock Market About To Complete The Riskiest Triple Top Of All Time?
ARE WEAK DATA AND A RISKY TOPPING PATTERN A DEADLY COMBINATION?
What Typically Happens When These Charts Flip?
TOPPING PROCESS DOT-COM BEAR MARKET
One of the best ways to strip opinions and personal bias out of any market analysis is to compare facts from the past to present-day facts. Near the latter stages of a major stock market topping pattern that formed between 1999 and 2001, the S&P 500’s 100-day moving average dropped below the 300-day moving average. The slopes of both moving averages rolled over in a concerning manner.

TOPPING PROCESS FINANCIAL CRISIS BEAR MARKET
All of the same boxes could be checked during the latter stages of the topping process in 2007-2008. The turn in the moving averages and the 100’s drop below the 300 was indicative of shifts in the intermediate and long-term trends, which speaks to a shift in expectations about future economic outcomes.

By the time the 100-day recaptured the 300 day in the 2000 case, the peak to trough decline in the S&P 500 reached 49.15%; the damage in the 2007 case was 56.78%. Therefore, it might be helpful to ask:
Does June 2019 look anything like the major stock market peaks in 2000 and 2007?

Given really good things happened after the bullish crosses in 2003 and 2009 shown above, and given the look of the 2019 chart below, it is difficult to make the argument the S&P 500 is currently in the process of forming a major peak similar to the peaks in 2000 and 2007. In short, the 2019 chart looks more like the major bottoms in 2002 and 2009 than the major peaks in 2000 and 2007.

WHAT CAN WE LEARN FROM THE 100’S CROSS OF THE 300?
Since 1949, how many times has the 100-day crossed above the 300-day? The answer is 20 times, including a bullish cross on July 15, 2003 and a bullish cross on September 25, 2009; both occurred after the major bear market declines. What happened next in the stock market? One to five years after the bullish cross, the S&P 500 was higher in roughly 95% to 100% of the cases with average gains ranging from 15.45% to 66.38%.

In 2019, the 100-day just cleared the 300-day, which represents a set of measurable facts. The table above shows what happened next in every historical case dating back to 1949. The table represents another set of facts. A common response might be, “That’s all great, but we have slowing profit growth, a slowing economy, and a serious trade war in 2019”. That is all true, but every single time in history the 100-day dropped below the 300-day (as it did early in 2019) there were serious and legitimate fundamental concerns. How do we know that? The stock market declined in a manner that caused the 100-day to drop below the 300-day (a significant event requiring significant fundamental issues).
WHAT CAN WE LEARN FROM MARKET BREADTH?
The 2006-2008 chart below shows NYSE advancing volume less declining volume near the stock market’s 2007 major peak. Three noteworthy factual events are shown on the monthly breadth chart below: (1) NYSE Advance-Decline Volume (NYUD) dropped below the Bollinger Band (BB) centerline, (2) NYUD closed below the lower BB, and (3) the BB centerline rolled over in a concerning manner.

The same monthly breadth chart in 1998-2001 was a confused and indecisive mess, but ultimately all three boxes were checked (drop below centerline, close below lower Bollinger Band, and centerline rolled over).

How does the same breadth chart look today? The answer is a lot more constructive. After box one was checked (monthly close below the centerline), market breadth improved dramatically as noted on January 21, 2019.

Dating back to 1949, how many times has a similar head-fake look appeared on the monthly chart of NYSE Advance-Decline Volume? The answer is four times: 1962, 1990, 2011, and 2012. What happened next in the stock market? After closing back above the monthly Bollinger Band centerline, good things happened in the historical cases looking out thirty days to seven years.

The charts below allow us to compare 2019 to the four previous breadth head fake cases and the major peaks in 2000 and 2007.

Given what we know today, the present day looks more like the head fake cases relative to the major stock market top cases. If the present day chart morphs into something that looks more like 2000 or 2007, our concerns would increase. The historical cases (bullish and bearish) provide us with factual guideposts going forward, which speaks to the need for ongoing flexibility and open-mindedness.
WHAT DOES HISTORY SAY ABOUT THE FIRST RATE CUT?
The market places high odds on the Fed cutting rates in either June or July. If so, it would represent the first rate cut since December 2008. Since some market participants have limited first-hand experience with the first rate cut in a new cycle, it might be helpful to review the longer-term history of Fed actions to lower the Federal Funds Rate. This week’s video also reviews last week’s scary economic data point, allowing us to better understand subsequent historical S&P 500 performance.
WHAT ABOUT SMALL SAMPLE SIZES?
The limited sample size of the breadth cases above is what it is. We cannot control sample sizes. There have only been three 40%-plus declines in the S&P 500 since 1950 (1973-74, 2000-2002, and 2007-2009), which also represents a very small sample size. Are we supposed to totally ignore these major declines because of the small sample size? According to Reuters, the S&P 500 was officially launched on March 4, 1957, meaning any S&P 500 study deals with a very limited historical data set. It is what it is.
When we study rare events, we acknowledge the sample size and try to learn anything that can add value in the present day. The same concepts apply to the breadth case and trend studies above. There are countless economic and market studies that are based on small sample sizes. Typically, the small sample size argument is only raised when the results run counter to someone’s personal opinion. When results agree with someone’s personal view, the small sample size is suddenly not a problem. If you believe a study or data set is irrelevant, there is an easy solution - ignore it.
MORAL OF THE STORY
The look of the S&P 500’s 100-day and 300-day aligns better with the major bottoms in 2002 and 2009 relative to the major tops in 2000 and 2007, telling us to remain open to longer-term bullish outcomes in the years ahead. The rare breadth head fake also looks more like constructive cases in 1962, 1990, 2011, and 2012 relative to the concerning looks in 2007-2008 and 2000-2001. The studies above tell us very little about what could happen in the next two days or two weeks.
The market still has a Fed statement and press conference coming Wednesday and important dates remain on the trade calendar. Numerous market events in 2019 have aligned with bullish probabilities including those covered on February 19, March 3, March 22, April 3, April 15, April 22, and April 30. Thus far, nothing has transpired that significantly discounts the previous bullish-leaning setups, including the recent pullback that was in line with historical expectations. We will continue to take it day by day with an open mind about all outcomes from wildly bullish to wildly bearish.
“For all the concern about the economy, the spread between junk-rated U.S. bonds and Treasuries hovers at 390 points, below its five-year average of 441 points, signaling that anticipation of corporate defaults is going down.”