
Demographics: A Triple Economic Boom Is Coming
THREE PRIMARY DRIVERS IN YEARS AHEAD
In the next 10-15 years, the financial markets and economy will be significantly impacted by three major forces: (1) Millennials, (2) Generation Z, and (3) artificial intelligence. These forces could propel the secular bull market in stocks into the mid-2030s.

DISTRACTED BY THE BABY BOOMERS
While it is true Baby Boomers are aging (59-77), we should not lose sight of the extremely large, well-educated, and economically influential younger generations, Millennials and Generation Z (Gen Z). Millennials overtook the Baby Boomers in 2019 to become the largest generation in the United States, which means focusing solely on Baby Boomers does not provide much insight into positive generational offsets.

Demographics provide insight into what is coming in the next 10-15 years, which is more important in the realm of investing than what happened in the last 10-15 years. Thus, markets are not focused on the current financial state of Millennials and Generation Z, but rather the inevitable progress they will make in the areas of income, home ownership, and wealth accumulation between now and 2035. As we march forward in time, the economic relevance of Millennials and Generation Z will increase every year and the economic relevance of the Baby Boomers will decrease.
WHY DEMOGRAPHICS MATTER
Having a large percentage of the population available to perform productive tasks is a key driver of economic growth, something that became painfully obvious during the COVID pandemic. As shown in the graph below, the prime working age population (25-54) declined between December 2007 and December 2012, a challenging period for the U.S. economy and stock market. When the prime working age population began to rise again in 2013, the S&P 500 was able to exceed the highs made in March 2000 and October 2007. After peaking in 2018, the prime working age population bottomed out near levels seen at the 2007 peak and began to rise again in late 2021. Thus, the trend in this key labor metric is favorable in 2023, which partly explains the resiliency of the U.S. economy. The graph below shows the population of the 25-54 age demographic.


KEY WORKERS ARE AVAILABLE AND WILLING TO WORK
Having a favorable trend in population does not necessarily equate to a population that wants to work. In the graph below, notice the 2020 COVID plunge in the age 25-54 labor participation rate, which was bad news for the U.S. economy. The good news is the key labor metric quickly resumed the favorable trend that began in 2015. In Q1 2023, the participation rate cleared the pre-COVID high, which means the labor market has improved significantly. The 25-54 labor force participation rate is above levels seen during the strong pre-COVID economic window.

EXPERIENCE AND SKILLS ADD VALUE
The second key metric that impacts economic growth is the quantity of workers with productive skills and experience, which is strongly correlated with earnings. Workers between the ages of 35 and 54 tend to be experienced and have a productive skill set that is in high demand. Thus, maximum career earnings logically fall in the age 35-54 window. Workers tend to spend and invest more when they are making good money.

A nation’s economy tends to thrive when the population between 25 and 54 is significant and that demographic is willing to work. A second economic boost comes when the economy has a large number of experienced and skilled workers between the ages of 35 and 54.
DEMOGRAPHICS ARE FAVORABLE
Millennials (a.k.a. Gen Y) are the largest generation in the United States. In 2023, Millennials are between 27 and 42 years old, which means the entire generation is in the prime working years window (25 to 54). A second boost comes from Millennials that are in their peak earning, spending, and investing years (35 to 54).
Between 2031 and 2035, 100% of Millennials will be in the peak earnings, spending, and investing window, which is similar to the very favorable 1995-2000 economic window when the median age of the Baby Boomers was 42.5 years old. Today’s largest generation, the Millennials, will be in a similar “demographic sweet spot” (median age of 42.5) between 2028 and 2034, telling us to remain open to better-than-expected economic and market outcomes between now and the end of 2034.


2023 REFERENCE POINT
The demographic comparison above speaks to the 1995-2000 and 2028-2034 windows. Since 2028 is still five years down the road, it is helpful to examine the period preceding 1995-2000. The median age of the largest generation in the United States between 1988 and 1994 was 36. The chart below shows S&P 500 performance between 1988 and 1994 (see blue box). Today’s largest generation, the Millennials, will be in a similar “demographic sweet spot” (median age of 36) between 2022 and 2027, telling us to remain open to better-than-expected economic and market outcomes between now and the end of 2027.


A ONE-TWO DEMOGRAPHIC PUNCH
Some demographers break Baby Boomers into two subgroups; Boomers One (1946-1954) and Boomers Two (1955-1964). Boomers Two are also known as Generation Jones. Boomers One and Generation Jones created a double boom in the 1989-2000 window, when 100% of the massive Baby Boomer generation were in their prime working years between the ages of 25 and 54. As shown below, the stock market performed quite well in the double boom window.

DOUBLE BOOM TWO
A similar double boom is coming in the United States. Right behind the Millennials (1981-1996) is the also very large Generation Z, born between 1997 and 2012. In 2023, the entire Millennial generation is in the prime working age window (25-54) and that will be true until 2035, creating an economic and stock market tailwind that will be in place for the next 12 years. It gets even better; Gen Z is projected to overtake the massive Millennials in 2034. Thus, two exceptionally large generations in the United States are on the younger end of the spectrum. The oldest members of Gen Z are 26 years old in 2023, which means another very large generation is just entering the prime working years window (25-54).

EXPERIENCED AND TECH SAVVY
Millennials were born between 1981 and 1996, which means they were between 7 and 22 years old when the internet had already exploded to over 600 million users in 2003. Millennials are comfortable with technology and the concept of self-education to acquire new knowledge and skills. Generation Z was born between 1997 and 2012, which means millions of them were not born yet when the iPhone was introduced in 2007. Members of Generation Z grew up in a world with internet access and smart phones, making them arguably the most tech savvy generation in U.S. history to enter the workforce.

“Work by the firm’s economic team, along with an in-depth survey of Generation Y and Z consumers, uncovered a significantly brighter outlook for the U.S. in the coming decades than previously thought. As Gens Y and Z combine in the workforce, these two outsized generations could power higher consumption, wages and housing demand, all pillars of GDP growth.”
Having a lot of workers in the prime working age window is good for the economy. A second boost can come when large demographic groups are experienced and highly compensated. When Millennials are in their peak earning, spending, and investing window between 2031 and 2035, Gen Z will be between the ages of 19 and 38, which means experienced Millennials will be working with a highly skilled and educated workforce.
In 2023, the economic and investing future is bright with two very large segments of the population currently ranging between 11 and 42 years old. In five years, they will be between 16 and 47 years old. In 12 years, they will be between 23 and 54 years old, which means the labor market should remain quite favorable between 2023 and 2034 for economic growth and innovation.
WEALTHY BOOMERS ARE STILL STIMULATING
While it is true Boomers are aging (59-77), they are part of a hybrid retirement income generation, which has some positive elements. Congress approved Internal Revenue Code Section 401(k) in 1978 forever changing the retirement income landscape. According to Yardeni Research, Baby Boomers had a net worth of $74.8 trillion at the end of Q1-2023, with a significant portion of that wealth stored in tax-deferred 401(k)s and IRAs. Since the oldest Boomers are 77, a significant portion of the formerly largest generation are already subject to required minimum distributions (RMDs), which should encourage discretionary spending and gifting to younger generations.

BOOMER BULL MARKET
The chart below was shown on July 10 in an article that provides visuals for secular bull markets and periods of secular stagnation.

The following chart shows the same period with demographic milestones.

Millennial and Gen Z Bull Market
The charts below show the S&P 500’s change in character during a secular period of stagnation (2000-2012) and the early stages of a new secular trend (2013-2016). During the periods of secular stagnation, the market tends to oscillate above and below the 200-week moving average shown in blue. During secular bull markets, the market tends to make stands near an upward-sloping 200-week moving average as it did in 2016.

The S&P 500 made a stand in October 2022 at an upward-sloping 200-week moving average, which kept the secular trend door open. However, notice in the two S&P 500 charts above, the market bounced at the 200-week in 2008 but then reversed and accelerated to the downside. Thus, between October 2022 and early June 2023, the market was improving but had not cleared some important hurdles.

One of the key “this does not look like the failed bear market rallies in 2002 and 2008” hurdles was cleared on June 2, 2023. In the failed rally attempts in 2002 and 2008, S&P 500 weekly RSI could not clear 55 (chart below). On June 2, 2023, weekly RSI closed at 63, which increased bullish odds. How painful were the drawdowns in 2002 and 2008 after weekly RSI failed near 55? Very painful - the additional loss in 2002 was 33.51%; in 2008, the additional loss was 52.54%. Weekly RSI closed on July 21 well above 55 at 69, which does not align with “ongoing bear market” odds.

DEMOGRAPHICS AND COMMON SENSE
Typically, factors that have broad and long-lasting economic and market impacts are easy to understand when you break them down into smaller pieces. If you want to understand the impact of demographics, evaluate your own spending and investing habits over time and those of people older than you and younger than you.
When you earn more, you tend to spend and invest more, which is good for the economy and corporate earnings. We know the age and population figures for Millennials and Gen Z. We know they are going to age, gain knowledge and experience, become more productive and make more money. It is the reason for the expression you can’t stop demographics.
When there is an abundance of workers between the age of 25 and 34 (less experienced) to collaborate with workers between the ages of 34 and 54 (more experienced), the economy can operate in a more productive manner, which is beneficial for all segments of the population and financial markets.

COULD SEE A TRIPLE BOOST WITH AI
Future economic and market outcomes will be impacted by the double boost from Millennials and Generation Z. The significant strides that have been made with Artificial Intelligence (AI) applications in recent months tell us worker productivity could improve in numerous industries in the years ahead. The Baby Boomer bull market (1982-2000) was fueled in part by the introduction of the IBM PC in late 1981 and Lotus 1-2-3 (spreadsheets) in January 1983. In 1984, Apple introduced the Macintosh personal computer with a built-in screen and mouse.
“According to researchers at Goldman Sachs, widespread adoption of AI-powered tools could drive a 7% uplift to global GDP and raise productivity growth by 1.5 percentage points over a 10-year period,”
EDUCATION MEANS HIGHER FUTURE EARNINGS
There is a strong correlation between education and career earnings. The 2019 Pew Research Center chart below shows Millennials and Generation X are better educated than Baby Boomers. Markets are forward-looking mechanisms, and thus, from an investing perspective, the known gains that are coming in experience, earnings, home ownership, spending, and investing are highly relevant.

HOUSING: SUPPLY AND DEMAND IMBALANCE
According to Builder Magazine, housing’s share of GDP was 17.7% in the first quarter of 2021, which represented a near 14-year high. When housing is strong, it impacts the entire economy in a favorable manner. Morgan Stanley highlighted the favorable backdrop for housing in 2021:
The aging of millennials and Gen Z should also create opportunities in the housing market. Given this favorable demographic demand backdrop, along with tight housing supply following years of depressed building in the aftermath of the financial crisis, we believe residential real estate should perform well in the cycle ahead. We like exposure to US housing, and homebuilders, in particular.
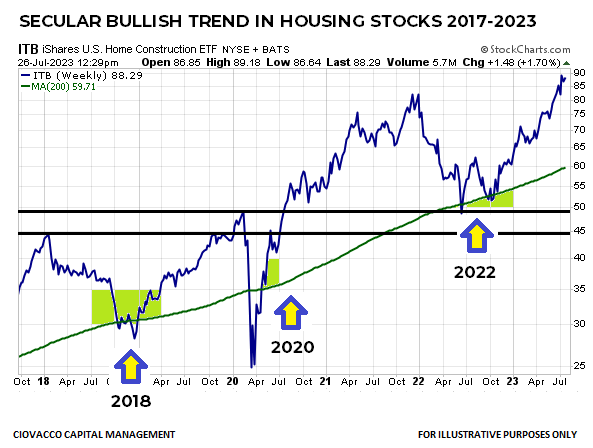
As we have noted numerous times in weekly videos, the chart of the Homebuilders ETF (ITB) seems to align with the demographically-induced secular bull market thesis. Housing stocks, while highly volatile, made stands near an upward-sloping 200-week in 2018, 2020, and in October 2022, which is exactly what we would expect during a secular bull market.
HOW IS ALL OF THIS HELPFUL?
The objectives of asset allocation are significantly different in periods of secular stagnation and secular bull markets. Thus, our goal is to manage against the base case, which is stocks are in a demographically-propelled secular bull market that could last until 2034. Under secular bull market conditions and in the context of higher interest rates/inflation, we will be willing to accept normal volatility as long as the weight of the evidence continues to align with the base case. If the weight of the evidence shifts to a secular stagnation profile, we will migrate to a more defensive portfolio allocation.
REALISTIC EXPECTATIONS
“You can’t stop demographics.”
The 1982-2000 secular bull market in stocks produced extremely satisfying returns. However, the 1982-2000 window included an economic recession (1990-91) and the 1987 stock market crash. Thus, a secular trend does not mean easy and with no volatility. Even if good things happen between now and 2034, we will have better odds of capturing satisfying returns if we embrace volatility as a normal part of even the strongest bullish trends.
FAQs - Getting Started with CCM
Subscribe to CCM’s YouTube Channel. Follow CCM on Twitter.
THE RESUMPTION OF THE SECULAR BULL MARKET
In the June 2023 weekly video below, data-based visuals are used to make the case the stock market’s secular trend resumed in October 2022.
WHY BONDS AND BALANCED PORTFOLIOS MAY DISAPPOINT
The video below covers a recent development in the financial markets that will impact portfolio returns for decades:
DEMOGRAPHICS AND STOCK MARKET RETURNS
This video overlays demographic data on the chart of the S&P 500 Index dating back to 1964 to gain an understanding of risk and reward between 2023 and 2034.
Demographics Say Bull Market Could Last Until 2035
18 Charts That Say 'Long-Term Opportunity In Stock Market'
demographics & secular trends:
The CCM weekly video to be published on July 21, 2023 will provide an important update on demographic trends in the United States and the potential impact on the economy and stock market. The video will be available on Short Takes (a link will also be available on the CCM Twitter Feed after publication).
SPY’S STRENGTH MATTERS
The odds associated with all investments (ETFs, individual stocks, bonds, etc.) are impacted by the market's tolerance for risk, which can be monitored numerous ways, including via the S&P 500 Index and/or the SPDR S&P 500 ETF (SPY). As shown in the SPY chart below, the market's risk-reward profile has significantly improved over the last 6 to 8 weeks. The market has flipped from a downtrend back to an uptrend, as market participants have become more positive about future economic and earnings outcomes. This is good news for stocks and risk assets in general.

RESUMPTION OF SECULAR BULL MARKET
As outlined in detail earlier this month, the evidence in hand points to a resumption of the secular bull market in stocks. The chart below shows the S&P 500 making a stand near an upward-sloping 200-week moving average, a hallmark of a long-term and sustainable bullish trend in risk assets. If the longer-term trend is resuming, it must be supported by an increasing appetite for risk, something that is evident in the SPY chart above and in the charts covered in the remainder of this article.

A.I. WILL IMPROVE PRODUCTIVITY
In recent years, the economy has been dealing with a mismatch between the availability of skilled workers and strong demand for goods and services. This mismatch has driven wages and inflation higher. Technology tends to automate tasks, which can make existing workers more productive. Thus, A.I. should help drive down inflation and increase corporate earnings. All of this is reflected in the chart of the Global X Robotics and Artificial Intelligence ETF (BOTZ). BOTZ has broken out from a multi-month basing formation and now has a profile indicative of more favorable odds. Charts cannot predict the future; they assist with the assessment of bull/bear probabilities.

DEMOGRAPHICS AND DISCRETIONARY SPENDING
Long-term, or secular, stock market trends are heavily influenced by demographics. The United States has two demographic tailwinds that are driving discretionary spending. The largest demographic, the Millennials, are in the early stages of their peak earnings and spending years. Consumption demand of Millennials is being complimented by wealthy Baby Boomers, who have significant balances in 401(k)s. The trend in the Consumer Discretionary SPDR (XLY) vs. Consumer Staples SPDR (XLP) ratio has a significantly improved look in July 2023 relative to 2022, which speaks to increasing confidence about the economy and earnings.

COMPLACENCY OR CONFIDENCE?
If we objectively review the chart of the VIX Volatility Index (VXZ) below, it is easy to see calendar year 2022 looks significantly different from 2023. This shift reflects expectations that future stock market volatility will be tamer relative to 2022.
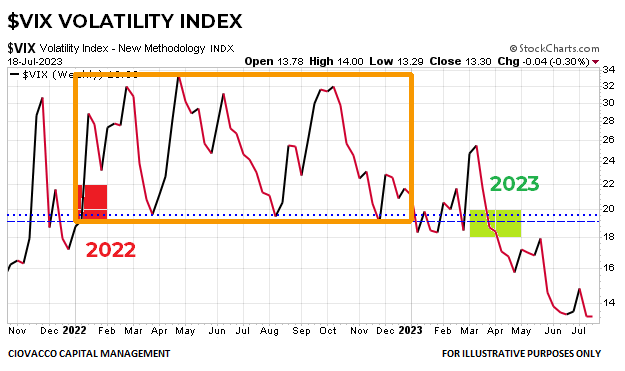
It may seem logical to read a low VIX as a sign of investor complacency. A recent tweet from Mark Ungewitter says that may not be the case. Historically, a VIX below 14 has been indicative of strong bullish trends in the S&P 500.

INSTITUTIONS ARE IN NO RUSH TO SELL
Anchored Volume Weighted Average Price (AVWAP) can be used to monitor market participants' appetite for risk. The AVWAP profile for the NYSE Composite Index shows selling pressure at key points in 2022. In recent weeks, the multi-sector index found buying support near the AVWAP lines tied to the COVID high and COVID low. In July, price has pushed back above the thick AVWAP band that acted as resistance in Q1. The S&P 500 and NASDAQ successfully pushed away from similar AVWAP bands earlier in 2023. The current look of the chart below speaks to a rally that is broadening out in a constructive manner.

GOLD SHOWING RELATIVE WEAKNESS
The SPDR Gold Shares ETF (GLD) vs. SPY ratio below is stalling near an area associated with sustainable stock market lows in 2011 and 2020. After the 2011 low, the stock market rallied until 2015. The 2020 low was followed by gains that lasted for approximately 21 months.

HAVE YOU MISSED THE RALLY?
During the early stages of a new bullish trend, it is common for investors to believe all the opportunity has come and gone. The chart of the SPDR Dow Jones Industrial Average ETF (DIA) says that is most likely not the case. In 2022, DIA was making a series of lower lows and lower highs, a textbook downtrend. To flip from a downtrend to an uptrend, three major steps are necessary. First, the market needs to exceed the downward sloping trendline. Second, the market needs to print a higher low. Third, the market needs to print a higher high. DIA is trying to successfully complete the third step in July 2023, meaning an established uptrend could just be getting started.

CREDIT MARKETS SHOW INCREASING CONFIDENCE
Since the history of the SPDR High Yield Bond ETF (JNK) is limited, the chart below shows the Vanguard High Yield Corporate Bond Fund (VWEHX) dating back to 1998. Notice how high yield bonds found buying support near the 50-month moving average, shown in blue, near major stock market lows in 2002, 2009, 2016, 2020, and 2022. In the historical cases, the stock market rally had much further to run.

CONTRADICTS IMMINENT RECESSION THEORY
If widespread layoffs, a big hit to corporate earnings, a painful recession, and Fed rate cuts were just around the corner, would we rather own economically-sensitive stocks or more-recession-friendly Treasury bonds? The answer is simple - Treasury bonds, which would get a tailwind from Fed rate cuts, rather than stocks which would be susceptible to declining earnings per share. The SPDR S&P 500 ETF SPY vs. iShares 3-7 Year Treasury Bond ETF (IEI) ratio just broke out following an 18-month period of consolidation, showing market participants prefer growth-oriented SPY over defensive-oriented IEI.

STOCKS TYPICALLY DO WELL WHEN THIS HAPPENS
When the U.S. Dollar vs. S&P 500 ratio drops below and moves away from the 200-week moving average, shown in red, it speaks to an increasing appetite for risk. The S&P 500 is shown in the bottom panel.

ECONOMIC AND RATE CONCERNS
As concerns about inflation and higher interest rates started to increase in 2021, the First Trust Dow Jones Internet Index ETF (FDN) began to underperform SPY. As concerns about inflation and interest rates began to ease in the second half of 2022, the FDN vs. SPY ratio began to build a constructive multi-month base. Since early May 2023, the chart below has improved considerably, demonstrating an increased willingness to embrace growth-oriented assets.

SUBTLE BUT IMPORTANT
The left side of the Vanguard Total Stock Market (VTI) chart below has a constructive look with the blue 50-day moving average on the top of the moving average cluster and the silver 250-day on the bottom; this is what a strong uptrend looks like. For the first time in over a year, the right side of the chart has recaptured a similar and bullish look. In Q4 2022, the blue 50-day was still on the bottom of the moving average cluster; today, it sits on top, which means market participants are more optimistic on numerous timeframes.

NOT SCREAMING SYSTEMIC
There are problems with regional banks; problems that may be with us for several more years. However, the chart of the SPDR Financial Sector ETF (XLF) has held in an area that reduces the odds of a systemic banking crisis. Unlike 2007-2008, XLF has made a stand near the red 200-week moving average.

INFLATION, THE GREENBACK, AND RATES
All things being equal, the iShares Emerging Markets Bond ETF (EMB) would prefer an environment with lower inflation, lower interest rates, and a weaker U.S. Dollar. None of those conditions were present in 2022 and EMB suffered. The outlook has slowly improved since the second half of 2022. EMB is trying to break above a constructive multi-month base, which speaks to expectations about inflation, Fed policy, and the U.S. Dollar.

YIELD AND DEFAULT RISK
If we knew with 100% certainty the economy was going to avoid a recession and bond defaults would remain muted, would we rather own higher-yielding corporate bonds or lower-yielding Treasuries? The chart below shows investors do not seem overly concerned about a recession and widespread bond defaults.

CONFIDENT OR CONCERNED?
When investors became more confident near the February 2016 low in SPY, they shifted from a preference for the SPDR Consumer Staples ETF (XLP) to a preference for SPY. As a result the SPY vs. XLP ratio began to rise in early 2016. A similar and constructive reversal in the SPY vs. XLP ratio occurred near the major 2020 low in the stock market. The look of the chart below is very similar to the look following stock market lows in 2016 and 2020, which speaks to increasing confidence about the economy, earnings, and inflation.

WHAT DOES LONG-TERM MEAN?
Charts cannot predict the future. They help us assess the market's willingness to embrace or shun risk, which in turn helps us assess the probability of good things happening relative to the probability of bad things happening. There is no question the weight of the evidence supports significant improvement in the odds of good things happening in the coming months and years. A recent Ciovacco Capital weekly client review covered a rare signal in the broad S&P 1500 Composite Index (SPTM). Dating back to 2004, the signal has only occurred four previous times. S&P 500 performance following the historical signals speaks to the potential for additional stock market gains.

The table below shows the performance of the SPDR Technology Sector ETF (XLK) following the signals in the S&P 1500 Index. Both tables align with the title of the article, which references an improving longer-term outlook for stocks.

THE EVIDENCE HAS BEEN IMPROVING
In a criminal case, jurors want to see the weight of the evidence evolve over the course of the trial. A weight of the evidence approach works in a similar manner when assessing the evolving risk-reward profile of the S&P 500. As shown below via the topics covered since mid-May, the weight of the evidence has clearly evolved along a bullish path:
Debt Ceiling - Market Does Not Look That Bad.
S&P Profile - Looks More Like Bullish Periods vs. Bearish Periods.
Sector Strength - Better Than Most Believe.
Stocks vs. Bonds - Bullish Look.
Multiple Timeframes - Converging In Bullish Manner.
Volume - Institutions Are In No Rush To Sell.
Recession - Charts Not Screaming Economic Contraction.
VOLATILITY IS NORMAL
The charts above speak to odds looking out 36 months, rather than 36 minutes or 36 days. If stocks are higher in three years, investors who wish to take advantage of the long-term uptrend will have to endure normal volatility, givebacks, and corrections along the way.
SECULAR TREND - DETAILED UPDATE JUNE 2023
The video below provides visuals related to the status of the secular bull market in stocks:
BONDS MAY DISAPPOINT IN BALANCED PORTFOLIOS
The video below covers a major event that will impact asset allocation and portfolio returns for decades: