
Six Charts That Say A Lot About The Market’s Outlook
Cluster of Possible Support
The NASDAQ Composite’s anchored volume weighted average price (AVWAP) chart below, as of Friday’s close, says the market is at a very important juncture. It would be logical for buyers to become interested near the intersection of the AVWAPs tied to the COVID high, COVID low, 2021 high, 2022 low, and 200-day moving average. The fact that these levels were held on Friday, October 27, allowed for some prudent patience heading into Fed week. If buyers fail to step in at the critical juncture below and price fails to hold near the cluster of possible support, concerns would increase.
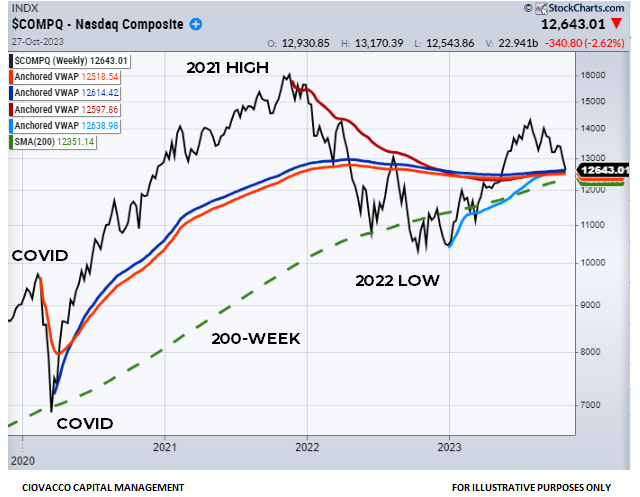
The table below shows where the NASDAQ finished last week in relation to the important areas shown on the chart above. The table is shaded in green to represent support levels that were still in play as of Friday, October 27. We will learn something about bullish odds if the NASDAQ makes a stand this week, just as we will learn something about bearish odds if price cannot hold support. If support is violated, the longer below, the more concerning it would become.

Important Levels for SPY
The weekly AVWAP chart for the SPDR S&P 500 ETF (SPY) also shows several areas of possible support below the closing price on Friday, October 27.

The fact that price remained above the AVWAP lines tied to the January 2022 high and October 2022 low told us that there was still a reasonable basis to believe the 2022-2023 rally was still intact. The 200-week moving average provides a reference point relative to the status of the market’s secular trend, which also remains intact.

S&P 1500: Hanging In There
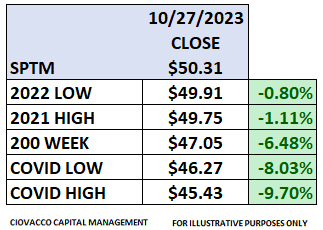
Like SPY and the NASDAQ Composite Index, the S&P 1500 ETF (SPTM) has some important bull/bear reference points in close proximity to the closing price on Friday, October 27, allowing for some risk-management patience to see how things unfold in the coming days and weeks.

SPTM has the AVWAP lines from the 2021 high and 2022 low less than 2% below the closing level on Friday, October 27. If price can make a stand this week, the further it pushes above these levels, the higher the odds the 2022-2023 stock market rally is still intact. If price fails to hold the black and red lines in the chart above, it would speak to increasing bearish odds.
RSP: A More Troubling Look
Areas of possible support provide logical bull/bear points of reference. If support holds, we learn something. If support breaks, that also provides valuable information. Unlike the NASDAQ and ETFs covered above, the Equal-Weight S&P 500 ETF (RSP) has dropped below numerous important levels, including the AVWAP lines ties to the COVID high, COVID low, 2021 high, and 2022 low. The longer price remains below these levels, the more concerning it becomes.

The red portions of the RSP table below indicate important levels that were not being held as of the close on Friday, October 27. If RSP can recapture these levels in the coming days and weeks, it would be a good sign for the bullish case. That may happen soon, but it was not the case heading into this week. The good news is RSP still has some very relevant AVWAP levels in the area tied to the major highs and lows in 2018. RSP also was holding above an upward-sloping 200-week as of the close on Friday, October 27.

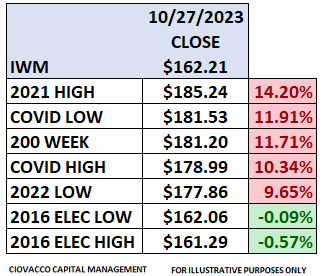
Small Caps: 2016 Election Levels
As shown in the chart below, the Russel 2000 Small Cap ETF (IWM) has given up an important cluster of possible support and has moved back to important AVWAP levels tied to the pre-2016 election high and low (black and mustard lines). IWM held above these lines in 2022; it would be concerning if it drops below them in 2023.
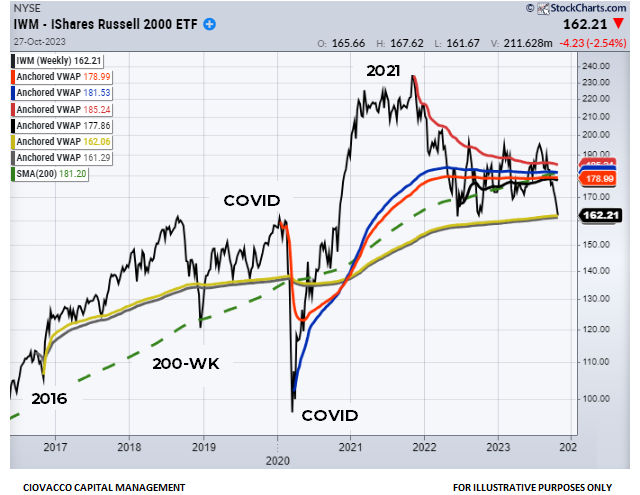
The red portions of the table below fall on the concerning side of the bull/bear ledger. The green portions say IWM needs to make a stand during Fed week. The good news is IWM has made stands numerous times above the black and mustard lines since late 2016 (see chart above).
Is It Now or Never For JNK?
The SPDR Barclay’s High Yield Bond ETF (JNK) has thus far held above the black AWAP line tied to the 2022 low. Notice how JNK remained above the black line during pullbacks in Q4 2022 and Q1 2023. If the black line continues to act as support, this would be good news relative to the odds of an imminent recession or debt crisis sparked by runaway government spending in the United States.

When you consider the enormous amount of government stimulus pumped into the system over the past three years, it is concerning that JNK failed to make a stand at the AVWAP lines tied to the COVID high and COVID low. To recapture those levels, JNK would need to rally back above $90.05; it closed last Friday at $88.61.

Reference Points Rather Than Predictions
The levels shown on the charts above serve as logical reference points to assist with a prudent IF/THEN contingency plan. Last Friday, we had evidence of troubling deterioration on the charts of RSP, IWM, and JNK. Near the close on Friday, October 27 we also had numerous “keep an open mind about better-than-expected outcomes” forms of possible support on the charts of the NASDAQ Composite, SPY, and SPTM.
If SPY, SPTM, and the NASDAQ can make stands this week and hold above the important levels outlined above, the odds of the 2022-2023 rally resuming would improve. Conversely, if SPY, SPTM and the NASDAQ follow RSP, IWM, and JNK and begin to break below important bull/bear levels, the odds of additional downside will increase.
Is the Debt Doom Loop Taking Down Stocks and the Economy?
ARE DEFICITS BECOMING ECONOMICALLY RELEVANT?
Patient and Measured Approach
possible support
As shown on the S&P 500 anchored volume weighted average price (AVWAP) chart below, dated Monday, October 23, the S&P 500 has not yet violated the major band of possible support. The chart is described in more detail in last Friday’s video. The data below is included in our contingency plan.

deficit spending and rates
The bond market has been taking note of ballooning federal deficits, impacting interest rates and the stock market. From Reuters:
WASHINGTON, Oct 20 (Reuters) - The U.S. government on Friday posted a $1.695 trillion budget deficit in fiscal 2023, a 23% jump from the prior year as revenues fell and outlays for Social Security, Medicare and record-high interest costs on the federal debt rose. The deficit comes as Biden is asking Congress for $100 billion in new foreign aid and security spending, including $60 billion for Ukraine and $14 billion for Israel, along with funding for U.S. border security and the Indo-Pacific region.
As concerns about government spending increased, the yield on a ten-year Treasury started pushing higher in September after moving sideways for several months.

how much damage?
While the market remains in risk-off mode, thus far, the market’s primary trend remains intact. The S&P 500 made a stand at the 200-week moving average in October 2022, similar to the stands made in 2016, 2018, and 2020.

As of the October 23 close, the S&P 500 remains 6.55% above the upward-sloping 200-week moving average. Notice the slope of the 200-week remains firmly up at this point, which is indicative of a strong long-term trend. If price drops below the 200-week and the slope flattens out/rolls over, concerns would increase.

SOME NOTEWORTHY developments
Last week, the S&P 500 was down 27 points Thursday and 21 points Friday, which resulted in a close below the prior rally attempt low, made on October 3, 2023 at 4229. The S&P 500 traded above 4229 during most of the session Friday but failed to hold it during the last ten minutes of trading. Failing to hold 4229 and continuing a string of late-week selloffs tell us to continue to respect the negative impact of higher intertest rates. If the S&P 500 can push back above 4229, and move away from 4229, last week’s move could be classified as a successful retest of the October 3 low.
Recent weakness also caused the S&P 500’s 10-week moving average to drop below the 20-week moving average for the first time since December 2022. The moving average crossover is indicative of incremental deterioration in the market’s longer-term uptrend.
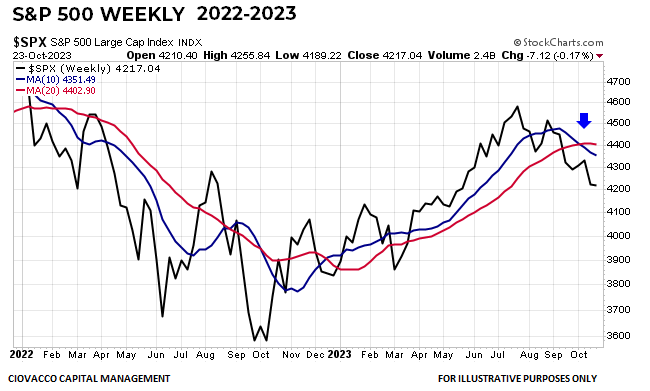
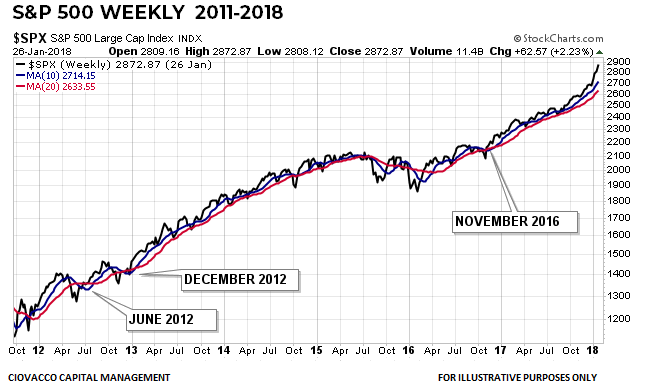
When the market’s underlying trend is strong, the 10-week closing below the 20-week can be a nonevent. For example, when the signal occurred on June 1, 2012 and December 7, 2012, the market found its footing quickly and continued to march higher (see chart below). Similarly, after the major S&P 500 low in February 2016, the 10-week closed below the 20-week on November 4, 2016 and the stock market quickly returned to a favorable uptrend.
Regardless of the outcomes in 2012 and 2016, it is not a good idea to ignore evidence of a waning uptrend. We examined similar bearish crosses in the context of secular bull markets, focusing on the 1956-1968 and 1989-2000 windows. In the twenty-three historical cases, the subsequent median twelve-month maximum S&P 500 drawdown was 7.17%. A similar drawdown in 2023 would hypothetically bring the S&P 500 down to 4017, which is between areas C and D in the AVWAP chart shown earlier in this post.
The daily chart of the S&P 500 below shows price testing the one-year base that was built between May 2022 and May 2023. Price was rejected at 4195 in February, telling us this area of prior resistance now represents an area of possible support. Monday’s close was 4217, after trading as low as 4189 intraday. A sustained break below 4195 and back into the prior base would be another negative development. A successful retest of the upward-sloping red 200-day moving average would not be particularly out of character for a new advance. Conversely, an extended stay below the 200-day would negate the positive impact of the June breakout above the long-term base.

DEMARK TREND EXHAUSTION
In addition to taking the primary trend and areas of possible support into consideration, it is also good to be aware of the DeMark 9-13 combo count that was recently completed on the S&P 500’s daily chart. The signal speaks to increasing odds of selling exhaustion and a bullish reversal, with an emphasis on the term odds.

LONGER & SHOrTER-TERM TRENDS
As noted numerous times in recent weeks, the bears control the short-term tape and the bulls have been unable to flip the script. However, that statement applies to every stock market correction that occurs within the context of a longer-term uptrend.
Other forms of evidence that tell us to keep an open mind about a resumption of the primary trend are the slopes of the 200-day and 200-week moving averages shown below. When price undercuts a flat or negative-sloped moving average the odds of price remaining below the moving average are higher. Conversely, the still-steep slopes below speak to a stronger trend, which means if price undercuts the moving average, the odds are higher that price will revisit or recapture the moving average. The slopes below say it is prudent to include the terms “patient” and “measured” in our contingency plan.

NO ASSUMPTIONS EITHER WAY
If the market can make a stand near support, we will happily take our contingency drawdown mitigation plan and toss it in the trash can. If things continue to deteriorate and/or cause abnormal stress in the markets, we will not be caught flat-footed. We will see how it plays out in the coming days and weeks.