The Message From Twelve Post-CPI Charts

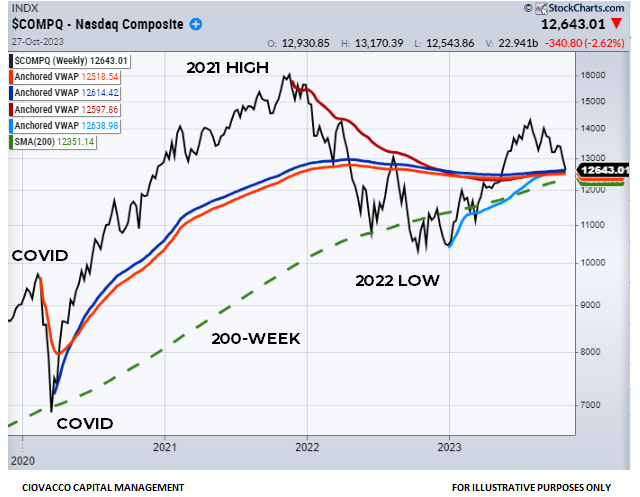
The NASDAQ Composite (ONEQ) chart below was shown in late October to highlight an area of possible support, based on anchored volume weighted average price (AVWAP) data.

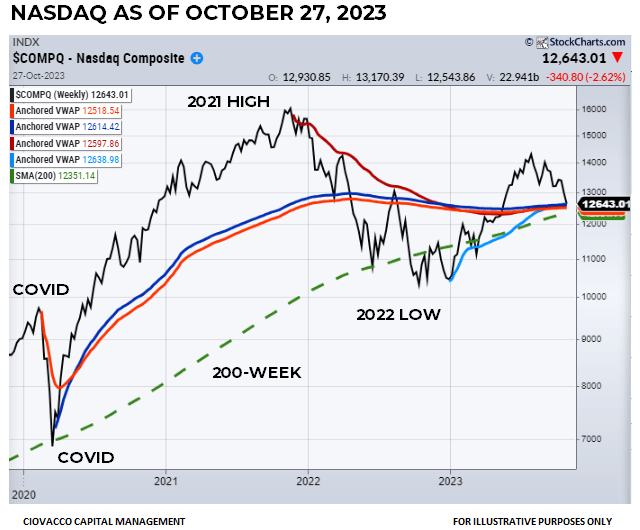
The updated November 14 version below shows buyers did eventually step in the crucial bull/bear battle zone. Given the high correlation between the NASDAQ Composite and the Invesco NASDAQ 100 Trust (QQQ), the outcome thus far is good news for the popular tech-heavy ETF.

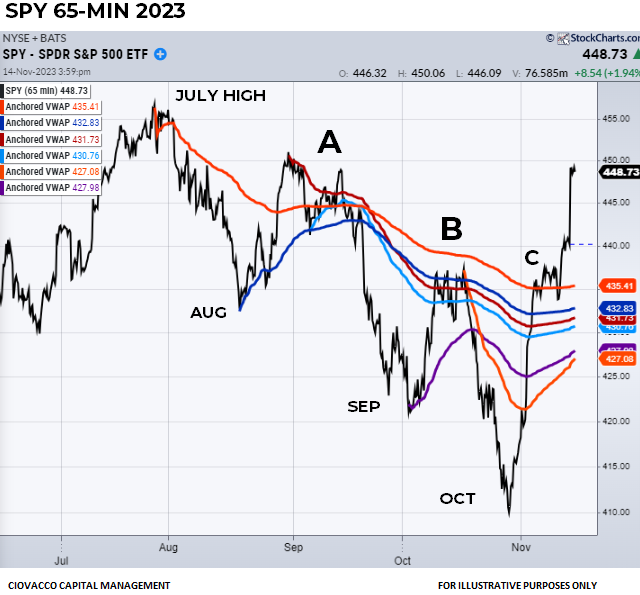
In recent sessions, SPY also made a stand at a similar bull/bear battle zone but was unable to clearly exceed the AVWAPs relevant to the intermediate-term downtrend that began in late July. That changed after the better-than-expected CPI report, which propelled SPY well above the area of congestion near point C in the graph below. The positive development tells us the odds of the July 2023 correction being over have improved significantly. The longer SPY can hold above point C, the more relevant it becomes.

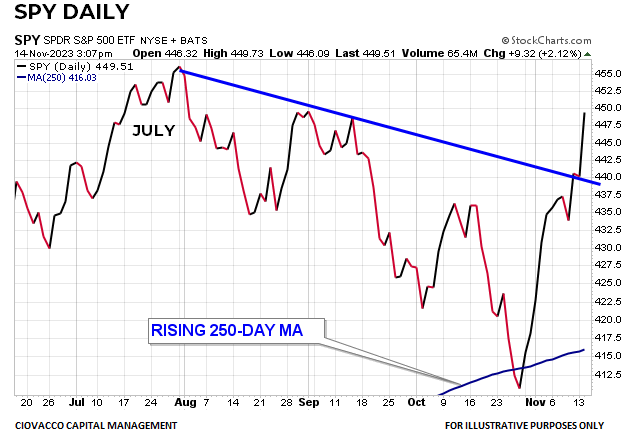
The traditional SPY chart below illustrates a change in character evident after Tuesday’s session. Price breached the 250-day moving average in October but followed that with a multiple-session push higher of rare magnitude.

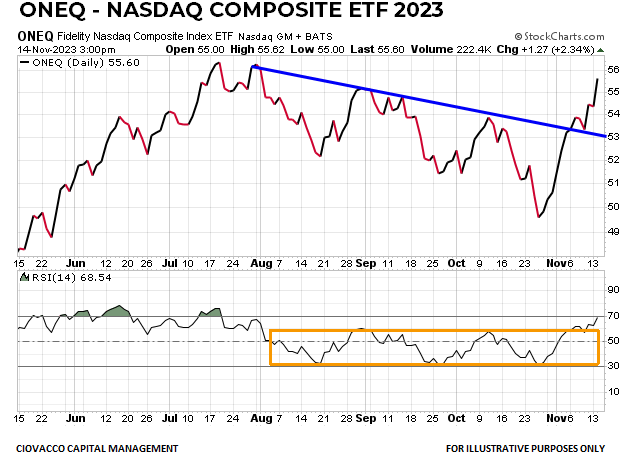
Similar improvement can be seen on the ONEQ chart below with price breaking above the downward-sloping trendline from the July 2023 peak. It is also a good sign that the relative strength index (RSI) was able to push above the orange box, which is indicative of stronger buying conviction relative to what was seen in August, September, and October 2023.

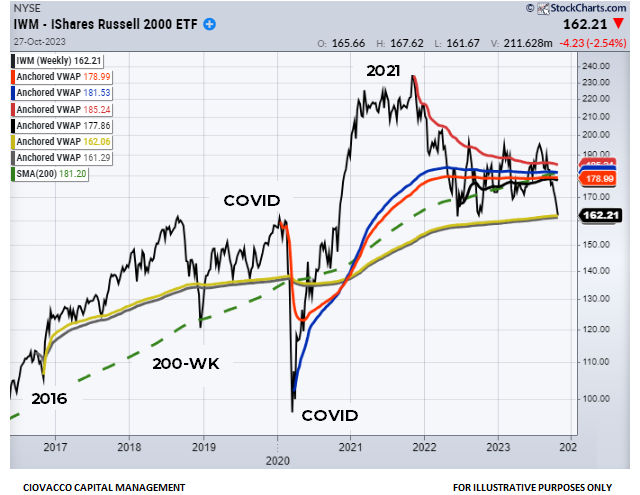
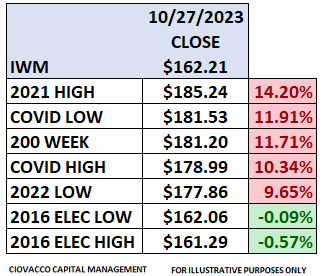
Small caps (IWM) have thus far held above an important support/resistance region that dates back to 2018. IWM has underperformed significantly and may be due for a period of outperformance.

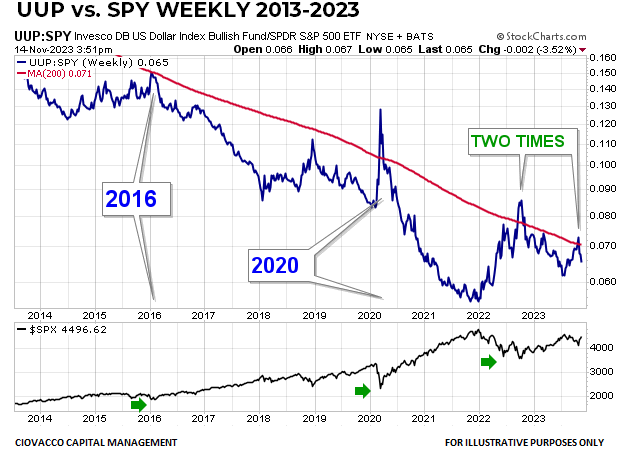
The strong dollar has been a headwind for numerous ETFs in recent weeks. As illustrated on the U.S. Dollar (UUP) relative to the S&P 500 (SPY) chart below, that headwind may be flipping over to a tailwind. In 2016 and 2020, it was a good sign for risk assets when the UUP:SPY ratio moved below and away from the downward-sloping 200-week moving average shown in red. The chart has a similar look in 2023.

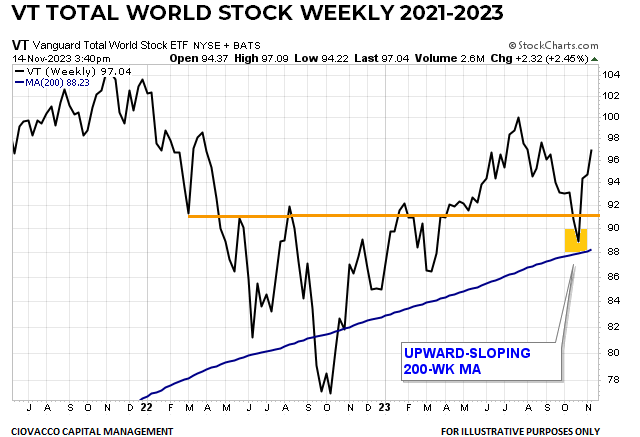
The better-than-expected CPI report impacted expectations related to inflation, Fed policy, interest rates, and the U.S. dollar. The shift in expectations may provide a lift for many foreign ETFs. Relative to the market’s risk appetite, it is a good sign that the Vanguard Total World Stock ETF (VT) recently made a stand near an upward-sloping 200-week moving average, which is indicative of a secular bull market and aligns with demographic trends.

Ultimately, bull markets are about risk appetite; the same can be said for rallies off intermediate-term stock market lows. The 2007-2009 financial crisis bear market resulted in an S&P 500 drawdown of approximately 50%, something most investors would like to avoid. When the S&P 500 peaked in October 2007, the conviction to own defensive consumer staples (XLP) picked up significantly relative to the conviction to own the S&P 500 (SPY). Notice how the XLP:SPY ratio turned up sharply in Q4 2007 and quickly exceeded the 50-month moving average. In 2008, the 50-month moving average started to turn up in a risk-off manner. If we compare the increasing-fear look in 2007-08 to the look in 2023, we see they look nothing alike, which tells us economic and systemic concerns were greater in late 2007 and early 2008.

Similar risk-off relative to risk-on characteristics can be seen on the chart of high yield bonds (HYG) below. In early 2022, the slope of HYG’s 250-day moving average rolled over in a bearish manner. In 2023, the 250-day is turning up in a constructive manner. After Wednesday’s CPI report, HYG cleared a multiple-month base (blue box) and printed a new closing high, which speaks to decreasing concerns about the economy and bond defaults.

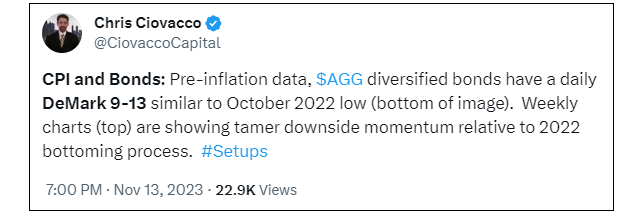
As noted in the November 13 tweet below, favorable setups on the chart of the iShares Core Aggregate U.S. Bond ETF (AGG) said be open to favorable CPI data and a favorable reaction in the bond market.

The chart below shows the performance of SPY relative to 3-7 year Treasury bonds (IEI). The SPY:IEI ratio broke out of a multiple-month base in June 2023. It appears as if the ratio has successfully retested the breakout zone (see green arrow).

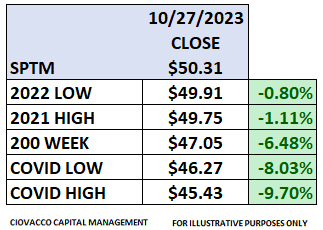
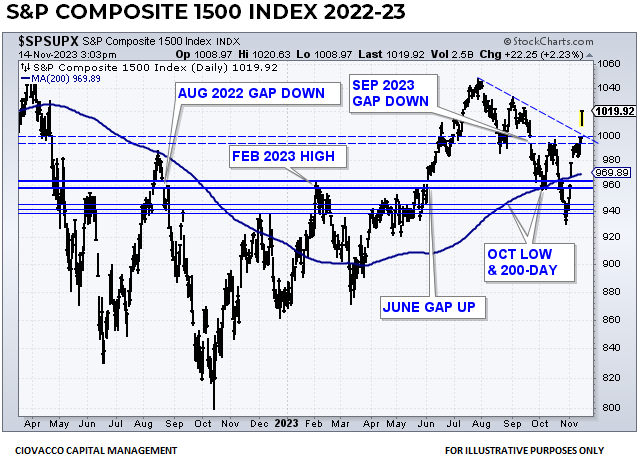
One of the legitimate concerns raised by bears in recent months has been weak stock market breadth (fewer stocks participating in rallies). If breadth is going to improve, a breakout in the broad S&P Composite 1500 Index (SPTM) is a good place to start. After CPI, SPTM gapped above the downward-sloping trendline tied to the July 2023 high. In recent sessions, SPTM recaptured the upward-sloping 200-day moving average, which increases the odds of the prior bullish trend reasserting itself.

Moral of the Story

After taking out some important levels and inflicting significant damage to the technicals, the market found its legs near the critical areas outlined on October 30. The developments following the better-than-expected CPI data increase the odds the primary bullish trend is in the process of retaking control.  

Six Charts That Say A Lot About The Market’s Outlook

Cluster of Possible Support

The NASDAQ Composite’s anchored volume weighted average price (AVWAP) chart below, as of Friday’s close, says the market is at a very important juncture. It would be logical for buyers to become interested near the intersection of the AVWAPs tied to the COVID high, COVID low, 2021 high, 2022 low, and 200-day moving average. The fact that these levels were held on Friday, October 27, allowed for some prudent patience heading into Fed week. If buyers fail to step in at the critical juncture below and price fails to hold near the cluster of possible support, concerns would increase.

The table below shows where the NASDAQ finished last week in relation to the important areas shown on the chart above. The table is shaded in green to represent support levels that were still in play as of Friday, October 27. We will learn something about bullish odds if the NASDAQ makes a stand this week, just as we will learn something about bearish odds if price cannot hold support. If support is violated, the longer below, the more concerning it would become.

Important Levels for SPY

The weekly AVWAP chart for the SPDR S&P 500 ETF (SPY) also shows several areas of possible support below the closing price on Friday, October 27.

The fact that price remained above the AVWAP lines tied to the January 2022 high and October 2022 low told us that there was still a reasonable basis to believe the 2022-2023 rally was still intact. The 200-week moving average provides a reference point relative to the status of the market’s secular trend, which also remains intact.

S&P 1500: Hanging In There

Like SPY and the NASDAQ Composite Index, the S&P 1500 ETF (SPTM) has some important bull/bear reference points in close proximity to the closing price on Friday, October 27, allowing for some risk-management patience to see how things unfold in the coming days and weeks.

SPTM has the AVWAP lines from the 2021 high and 2022 low less than 2% below the closing level on Friday, October 27. If price can make a stand this week, the further it pushes above these levels, the higher the odds the 2022-2023 stock market rally is still intact. If price fails to hold the black and red lines in the chart above, it would speak to increasing bearish odds.

RSP: A More Troubling Look

Areas of possible support provide logical bull/bear points of reference. If support holds, we learn something. If support breaks, that also provides valuable information. Unlike the NASDAQ and ETFs covered above, the Equal-Weight S&P 500 ETF (RSP) has dropped below numerous important levels, including the AVWAP lines ties to the COVID high, COVID low, 2021 high, and 2022 low. The longer price remains below these levels, the more concerning it becomes.

The red portions of the RSP table below indicate important levels that were not being held as of the close on Friday, October 27. If RSP can recapture these levels in the coming days and weeks, it would be a good sign for the bullish case. That may happen soon, but it was not the case heading into this week. The good news is RSP still has some very relevant AVWAP levels in the area tied to the major highs and lows in 2018. RSP also was holding above an upward-sloping 200-week as of the close on Friday, October 27.

Small Caps: 2016 Election Levels

As shown in the chart below, the Russel 2000 Small Cap ETF (IWM) has given up an important cluster of possible support and has moved back to important AVWAP levels tied to the pre-2016 election high and low (black and mustard lines). IWM held above these lines in 2022; it would be concerning if it drops below them in 2023.

The red portions of the table below fall on the concerning side of the bull/bear ledger. The green portions say IWM needs to make a stand during Fed week. The good news is IWM has made stands numerous times above the black and mustard lines since late 2016 (see chart above).

Is It Now or Never For JNK?

The SPDR Barclay’s High Yield Bond ETF (JNK) has thus far held above the black AWAP line tied to the 2022 low. Notice how JNK remained above the black line during pullbacks in Q4 2022 and Q1 2023. If the black line continues to act as support, this would be good news relative to the odds of an imminent recession or debt crisis sparked by runaway government spending in the United States.

When you consider the enormous amount of government stimulus pumped into the system over the past three years, it is concerning that JNK failed to make a stand at the AVWAP lines tied to the COVID high and COVID low. To recapture those levels, JNK would need to rally back above $90.05; it closed last Friday at $88.61.

Reference Points Rather Than Predictions

The levels shown on the charts above serve as logical reference points to assist with a prudent IF/THEN contingency plan. Last Friday, we had evidence of troubling deterioration on the charts of RSP, IWM, and JNK. Near the close on Friday, October 27 we also had numerous “keep an open mind about better-than-expected outcomes” forms of possible support on the charts of the NASDAQ Composite, SPY, and SPTM.

If SPY, SPTM, and the NASDAQ can make stands this week and hold above the important levels outlined above, the odds of the 2022-2023 rally resuming would improve. Conversely, if SPY, SPTM and the NASDAQ follow RSP, IWM, and JNK and begin to break below important bull/bear levels, the odds of additional downside will increase.